Total Clarity on Your Cash Flow

Summary
×Sites are running, projects are moving, and money is flowing out constantly.
But if you ask: How much did we spend this month? How much needs to be paid next month? Which project is over budget? Is there enough cash on hand?
You end up flipping through spreadsheets, asking the finance team, waiting for reports, and after all that hassle, the answer might not even be accurate.
This cash flow management system breaks down the finances for each project. How much is spent, how much is left, how much is due to be paid. It's all in one place.
See All Critical Data at a Glance
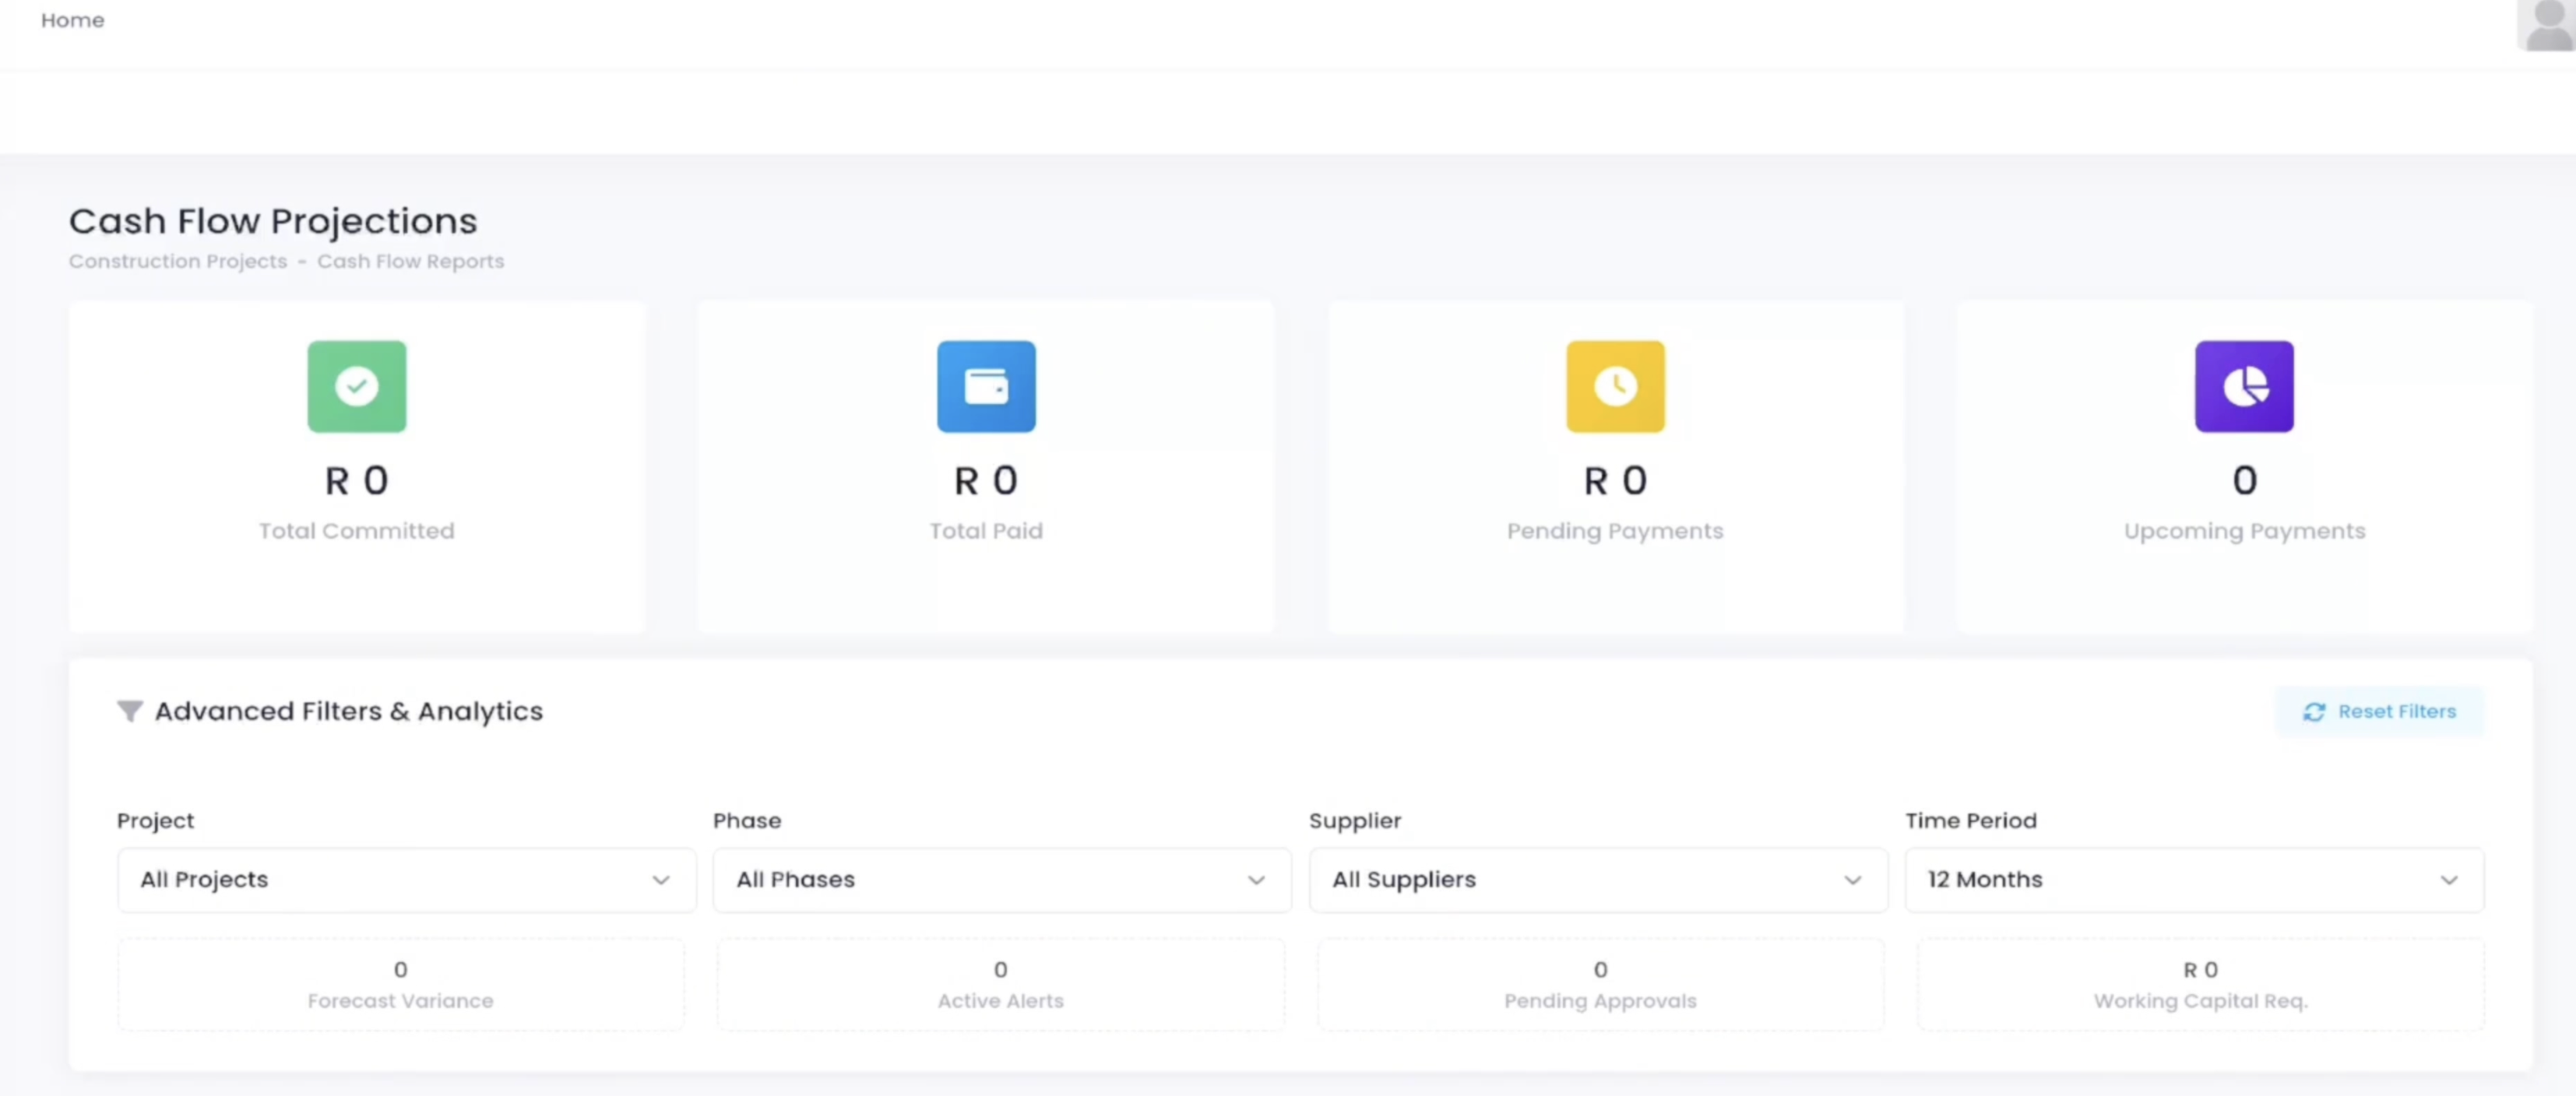
Open the page, and the top row of numbers lists the most critical information.
Total commitments, total paid, total pending payment, and total future payment obligations are all displayed at a glance.
On the right, there are filters. Want to see a specific project, phase, or supplier? Just select them. You can also adjust the time range. You can choose 12 months or 3 months, whatever you need.
Below that, four zeros stand out prominently: Forecast Deviation 0, Activity Alerts 0, Pending Approval 0, Working Capital Requirement 0. It's not that nothing is happening, but it tells you that everything is currently normal.
Project Ledgers, Itemized for Clarity
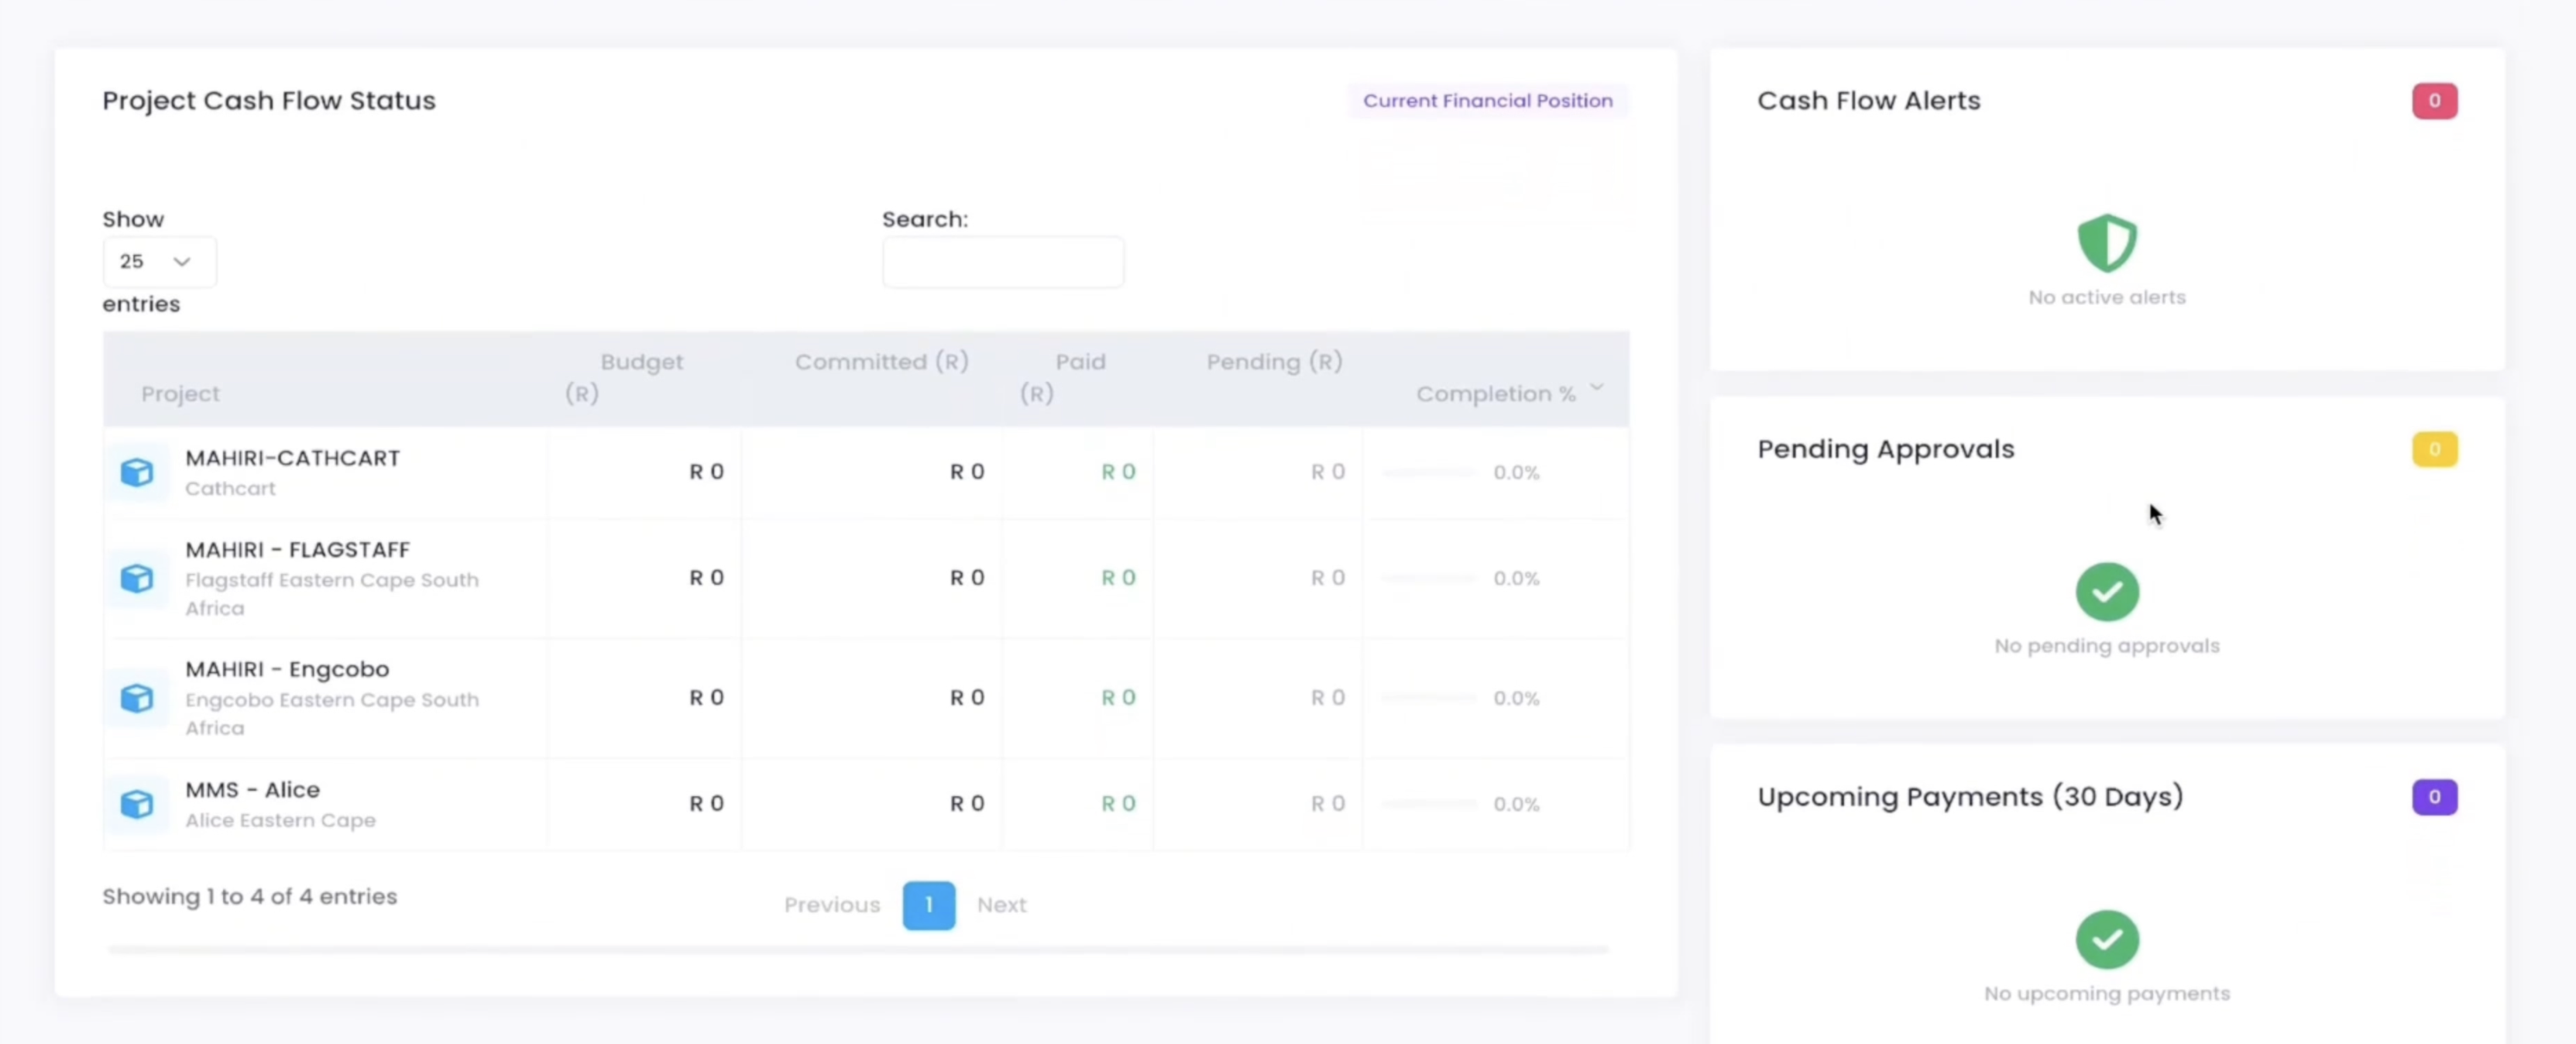
This is the project cash flow status table. All four projects are here, three under MAHIRI, one under MMS.
Each row represents the finances of a single project. Budget, total committed, amount already paid, amount pending payment, and current progress, all on one line.
Although everything shows zero for now, the framework is set up. Once money starts moving, every transaction can be traced.
On the right side, there are two sections: Cash Flow Alerts shows no alerts for now, Pending Approvals is also zero, and there's nothing due for payment in the next 30 days. Clean and clear, it gives you peace of mind at a glance.
Future Trends, Visualized at a Glance
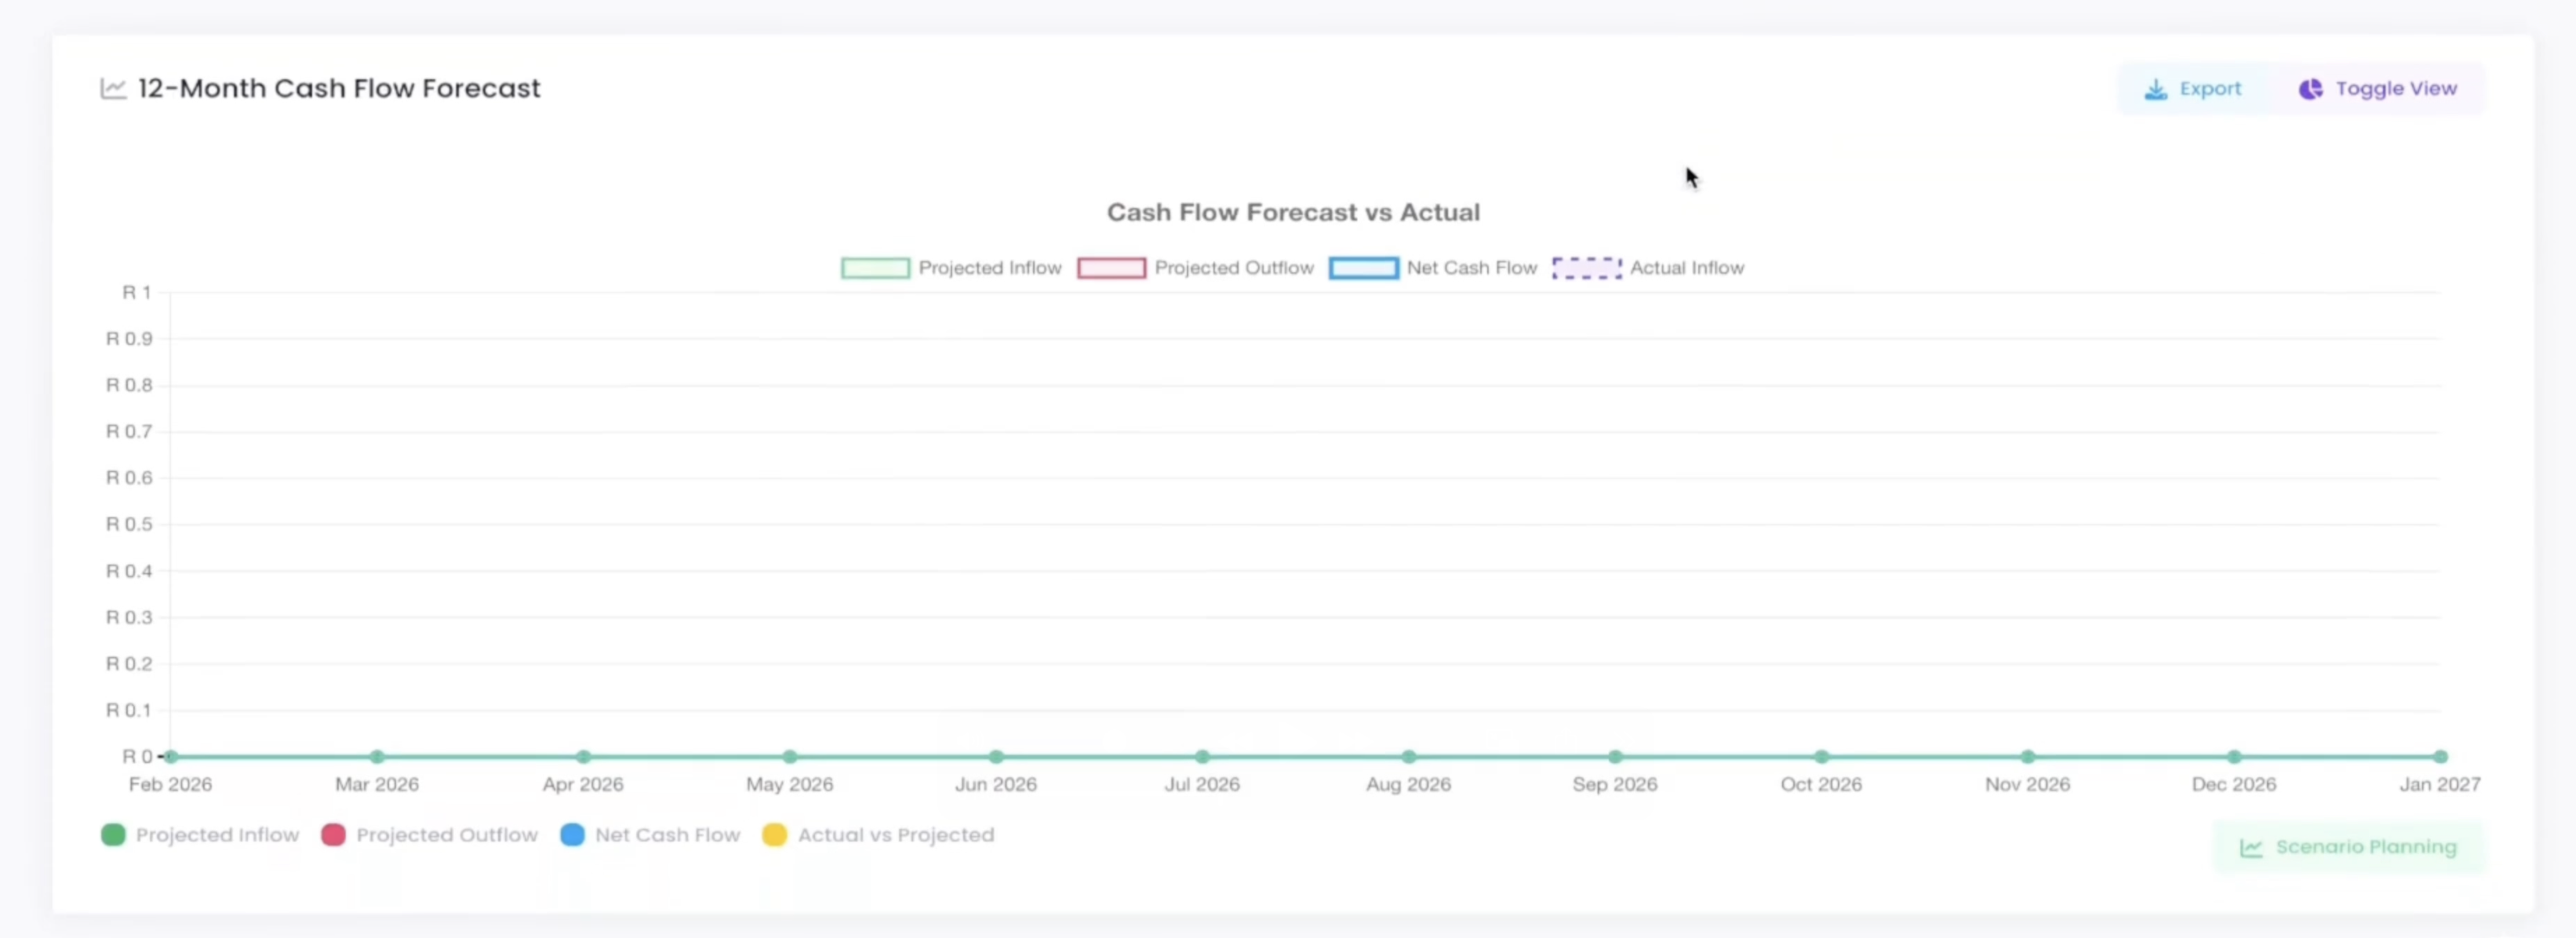
This is the 12 month cash flow forecast chart.
Green represents projected cash inflow, red represents projected cash outflow, blue is the net cash flow, and purple represents actual cash inflow. With these four lines plotted together, you can see exactly how money will move over the next year.
From February to January next year, the height of the bars shows the ebb and flow. Which months have higher inflows, which have higher outflows, when potential tight spots might occur, it's all in the chart.
No need to wait for month end reports or ask finance how much is needed next week. Just one look, and you know.
Managing Cash Flow Starts with Seeing Every Transaction Clearly
Budget per project, amount already paid, amount due next month, and the trend for the next year. This system turns the most headache inducing cash flow issues into a row of numbers, a few tables, and a single curve on your screen.
No need to dig through ledgers or wait for reports. Open the system, and your cash situation is clear at a single glance.