How Good Is Your Factory? These Numbers Tell the Story

Summary
×Want to know how the factory is running? No need to spend a day walking the floor or sitting through endless reports.
This system puts all the critical data in one place. Equipment efficiency, scrap rate, today's alerts, WIP levels. Every number speaks for itself.
A Health Report for Your Factory
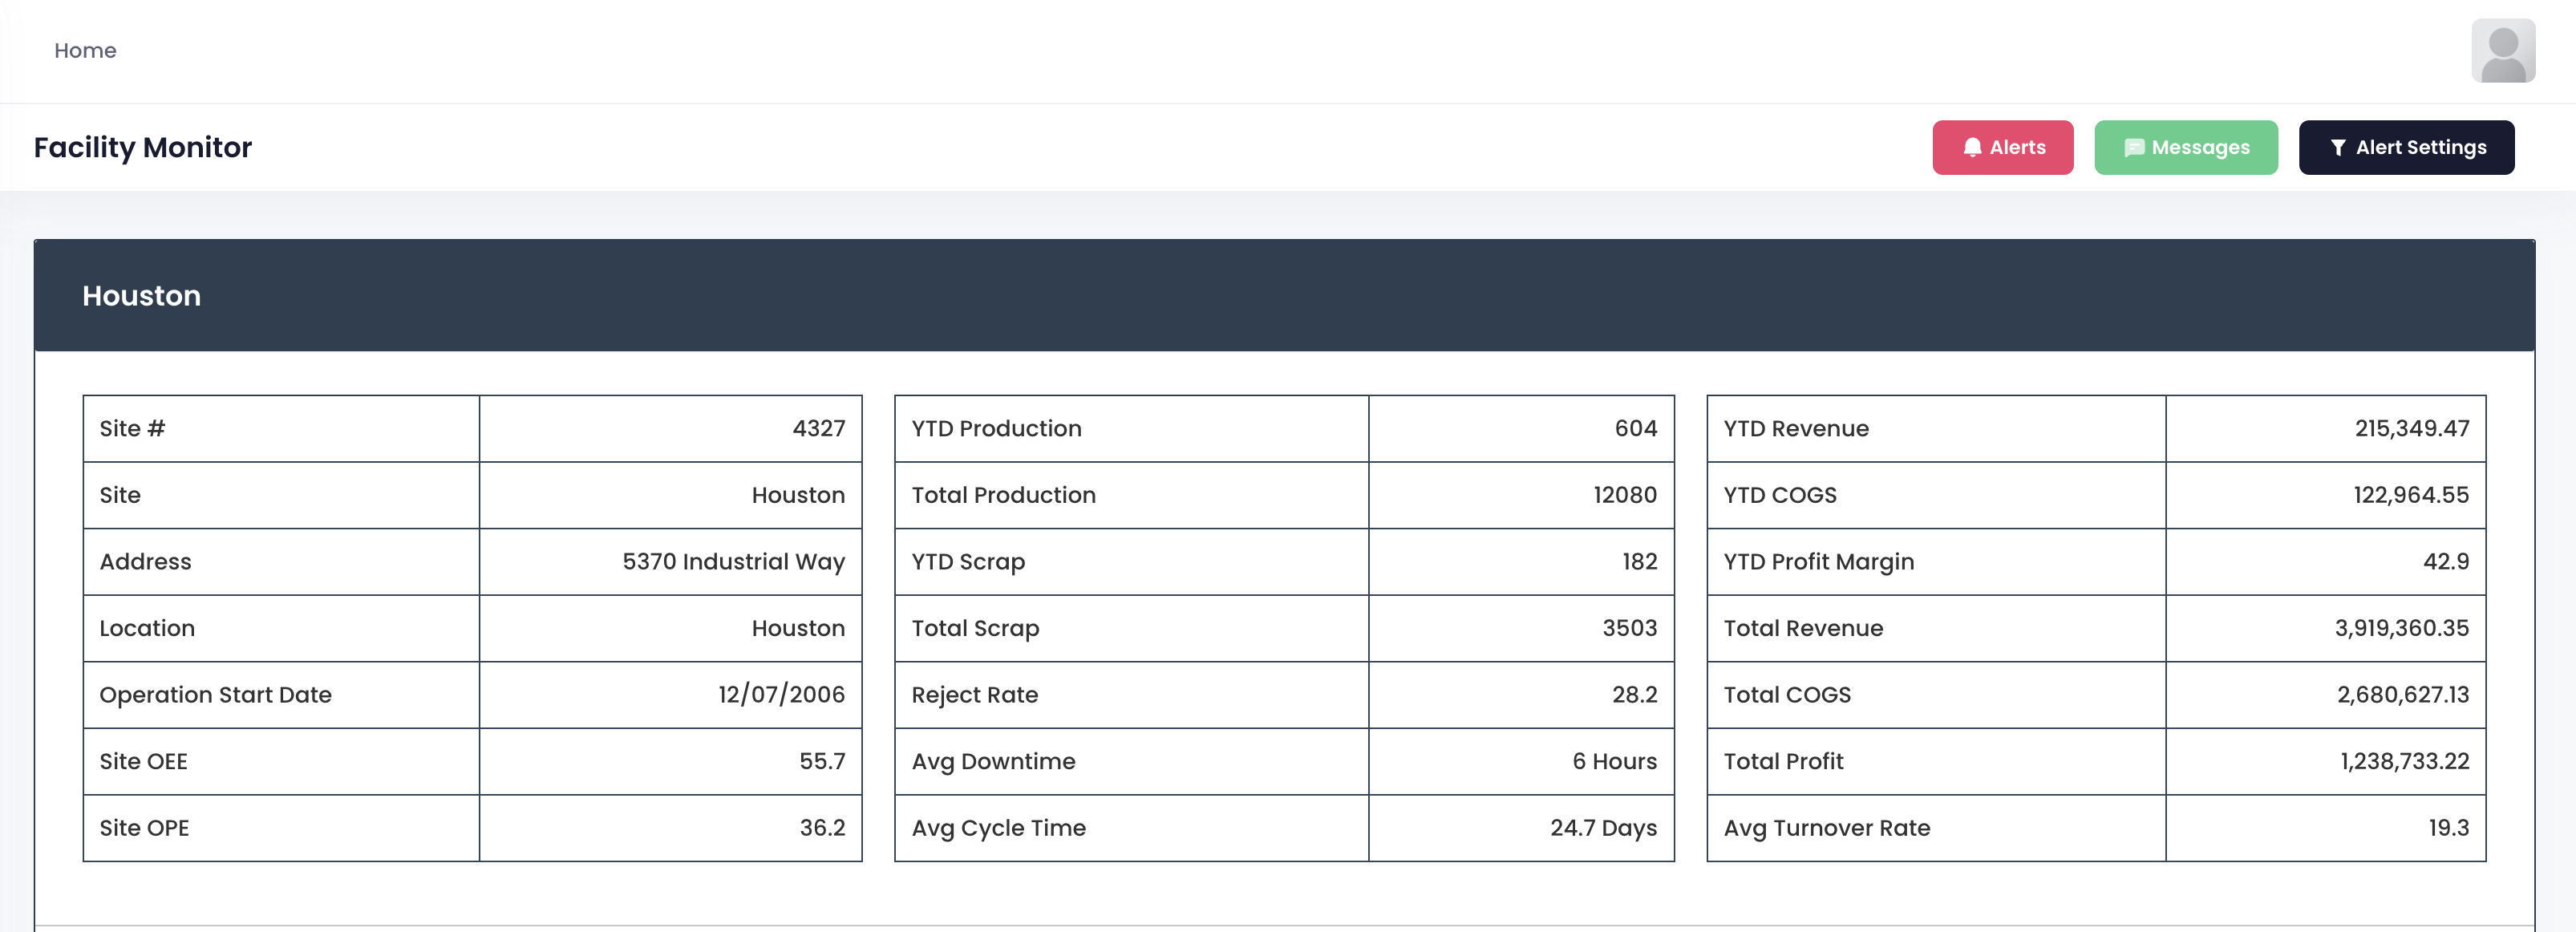
Open the page. At the top, basic info about the Houston facility. When it started production, where it is located. Clear at a glance.
Scroll down to the core metrics. Overall equipment effectiveness is 55.7, people efficiency is 36.2. Not high, which means room for improvement.
Production data tells more: 604 units made year to date, 12,080 total. Scrap is 182 year to date, 3,503 total. Reject rate is 28.2. That number is high. Time to check which part of the process is causing problems.
Further down is money. Year to date revenue is 215K, profit margin 42.9. Total profit is 1.23 million, average turnover rate 19.3. How much you make, how fast it moves. All clear.
What Went Wrong Today
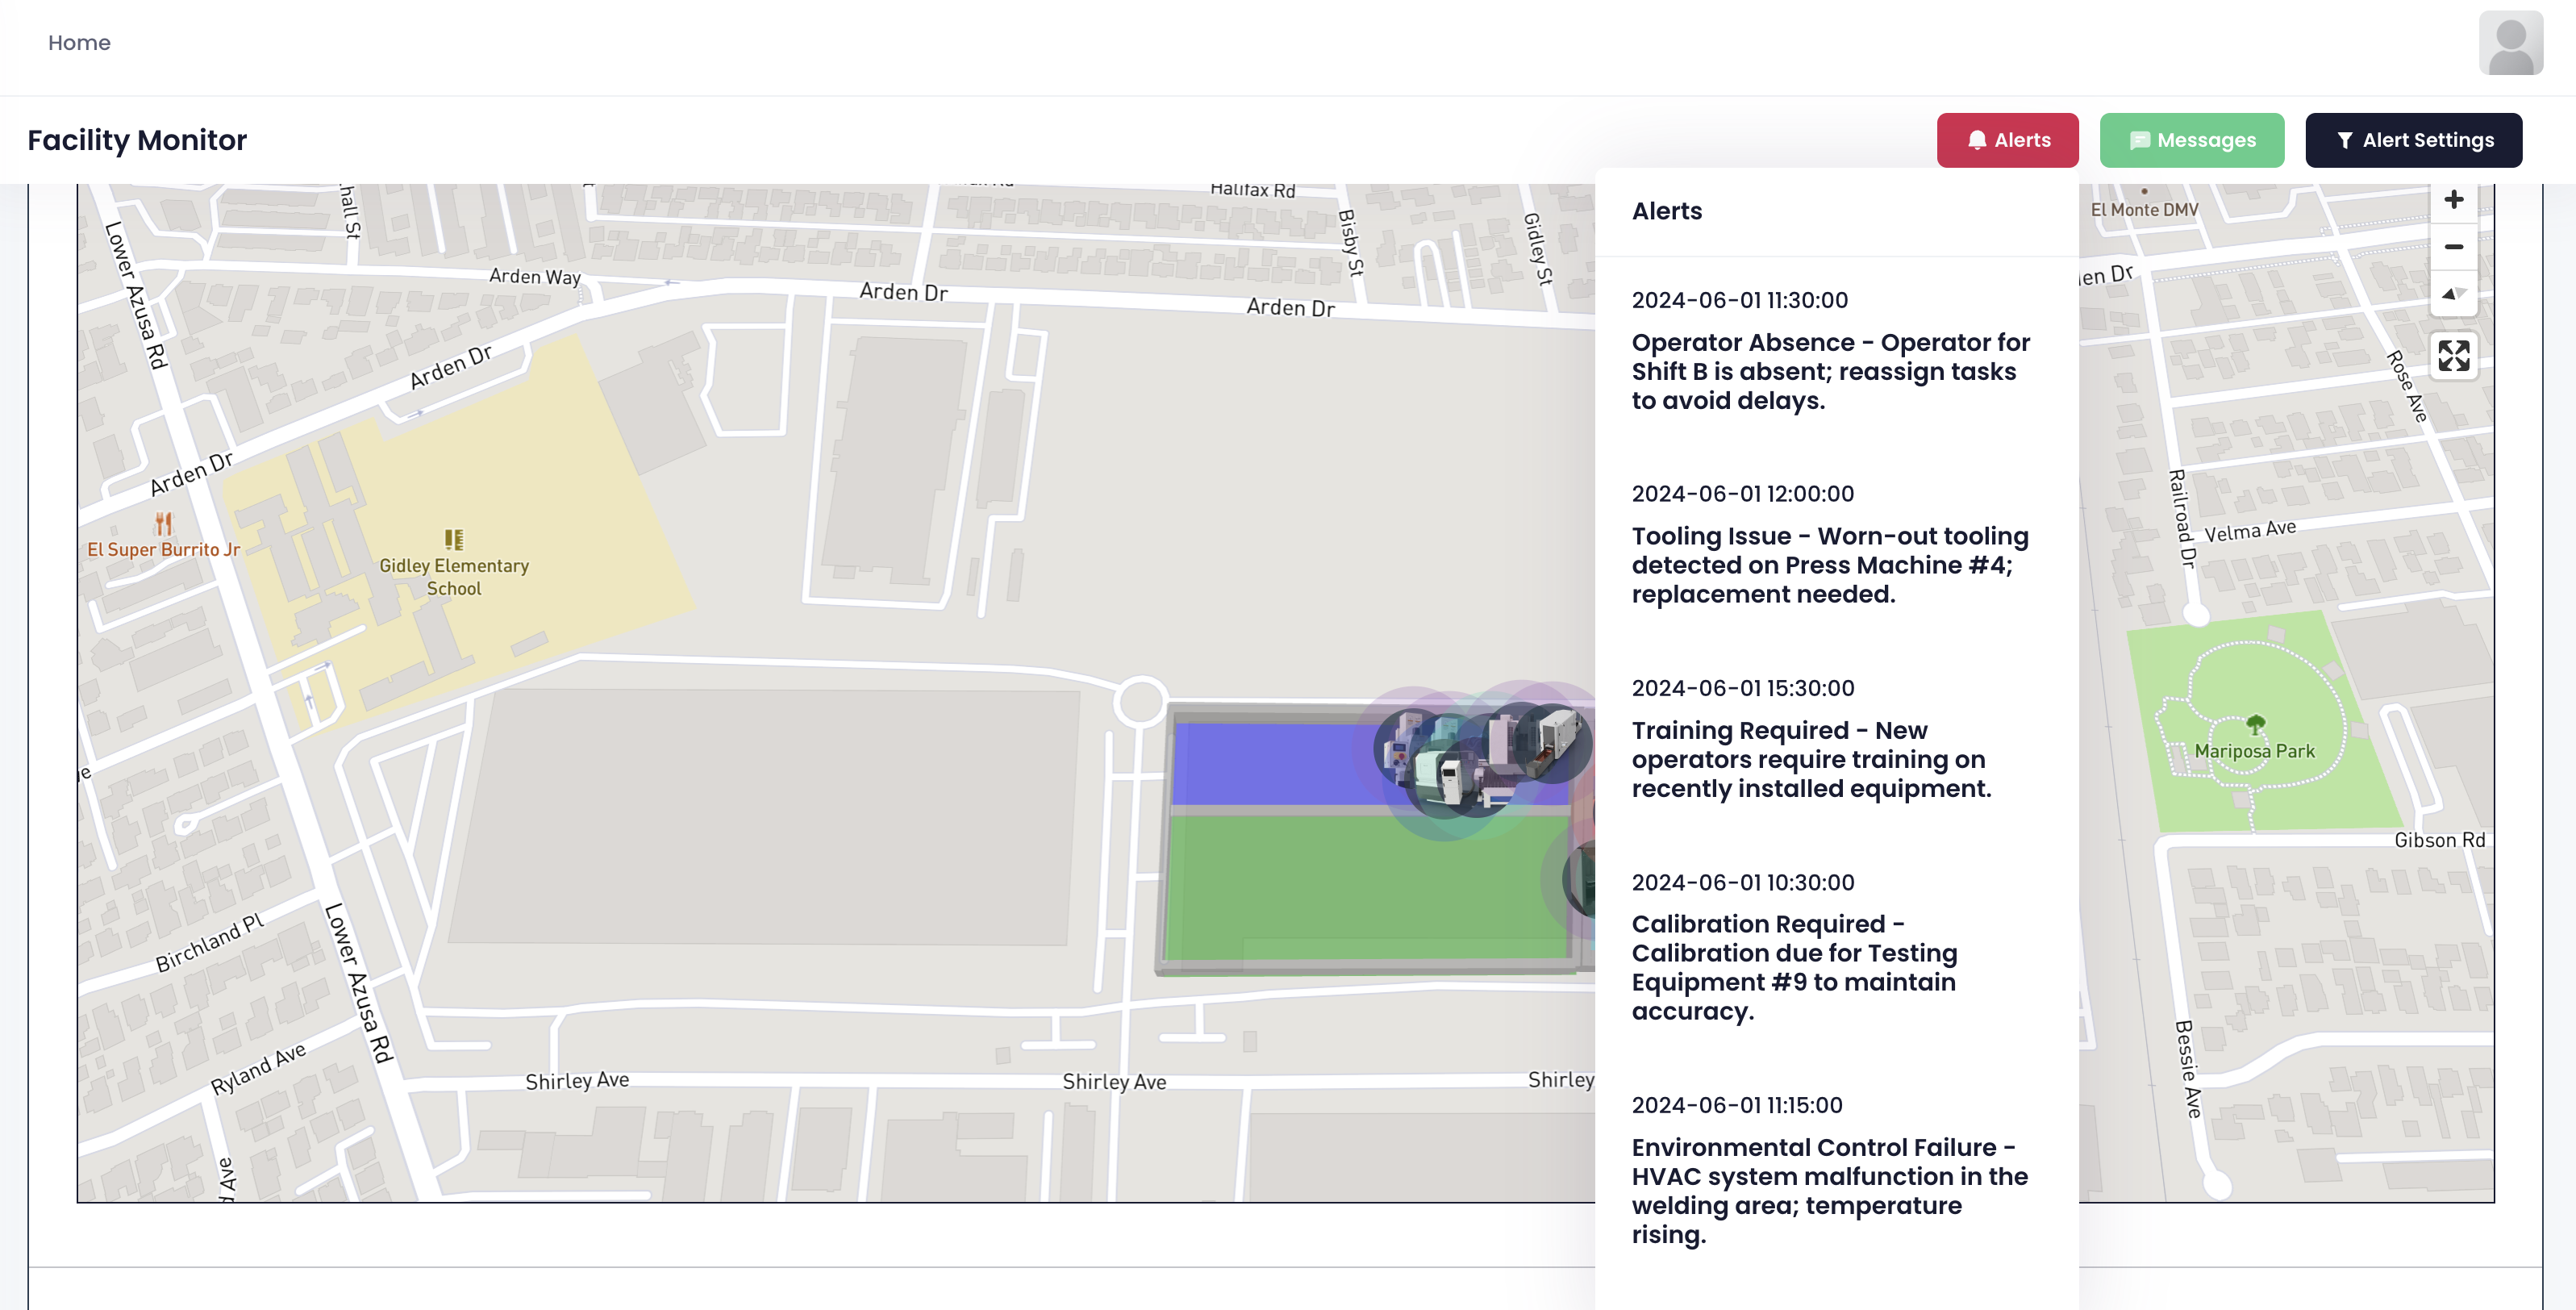
This is the alerts page. Five alerts. Each one is something that needs attention.
At El Monte DMV, someone from Shift B is absent. Tasks need reassigning. At Railroad Dr, press machine number four has worn tooling. Needs replacement. At Mariposa Park, new equipment installed. Operators need training. At Gibson Rd, testing equipment number nine is due for calibration. At Shirley Ave, the HVAC in the welding area is broken. Temperature rising.
The system does not wait until something becomes a crisis. It alerts you the moment a problem appears.
Where Did the Time Go
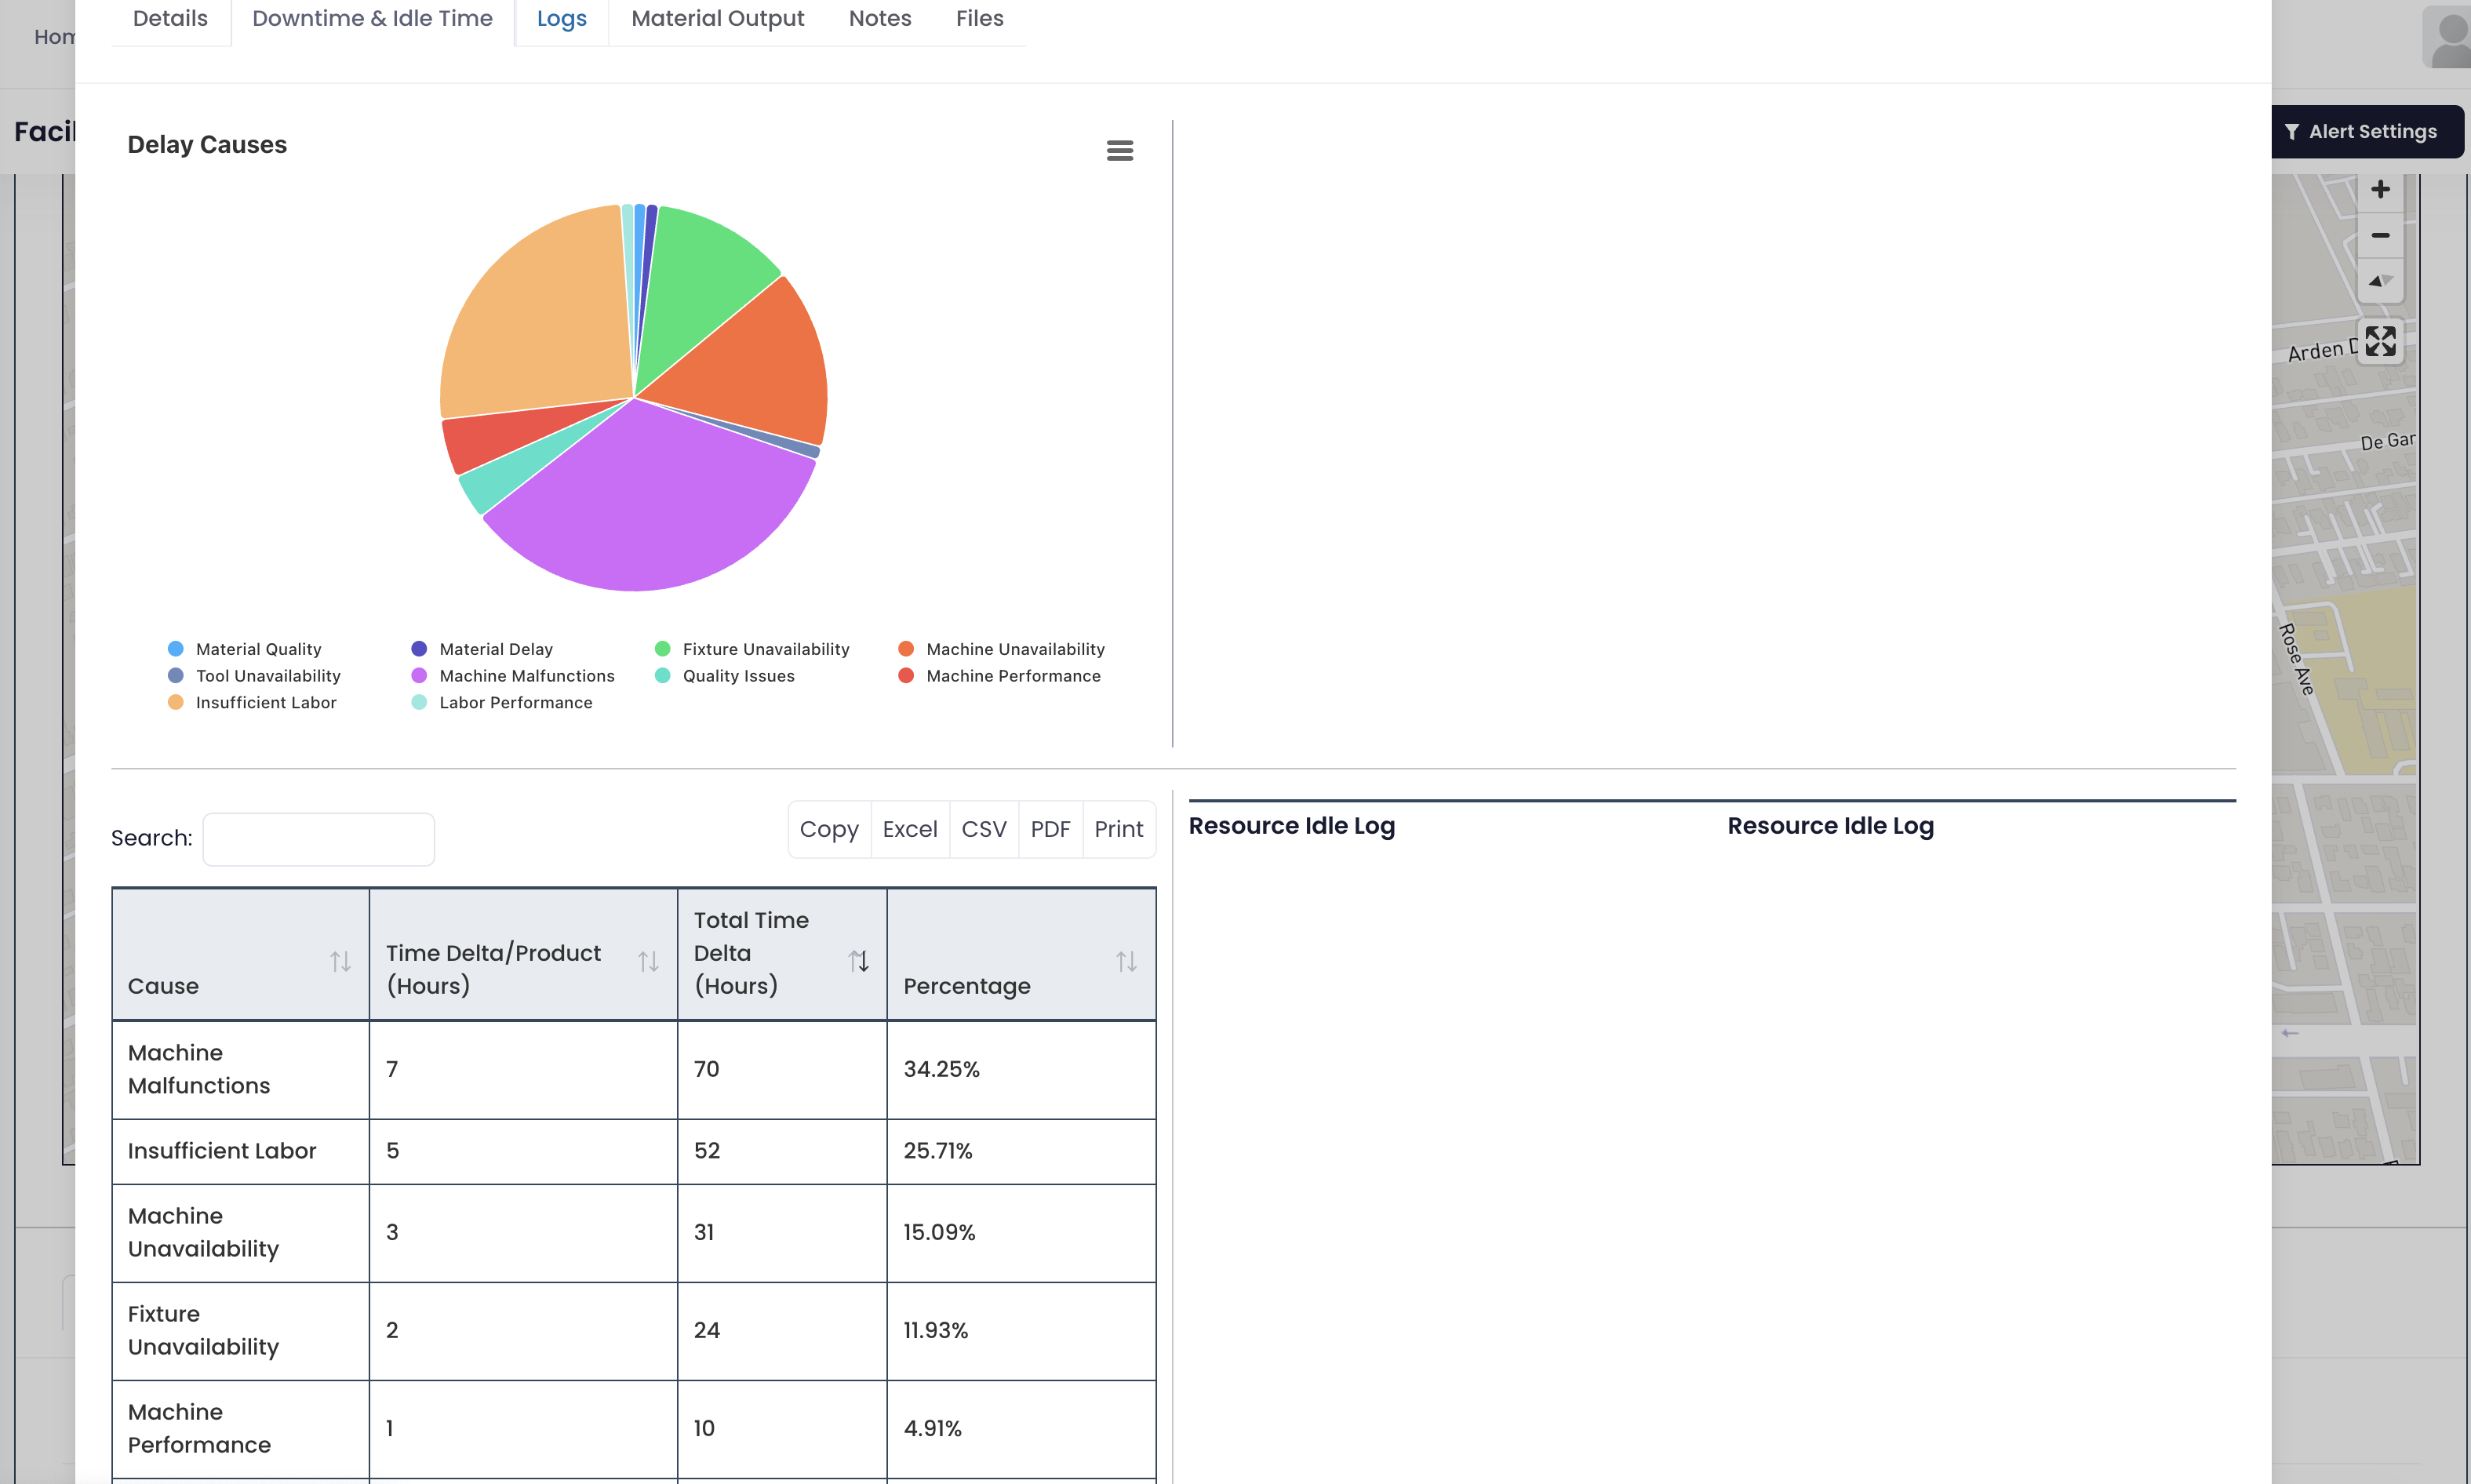
This is delay cause analysis. Every reason that slows down production, ranked by time lost.
Machine malfunctions rank first. 34 percent, 70 hours gone. Insufficient labor ranks second. 25 percent, 52 hours. Machine unavailability third. 15 percent, 31 hours. Fixture unavailability fourth. 11 percent, 24 hours.
No need to guess why delays keep happening. The system highlights the biggest problems. Fix machines first or add people first? The percentages tell you.
How Much WIP Is on the Floor
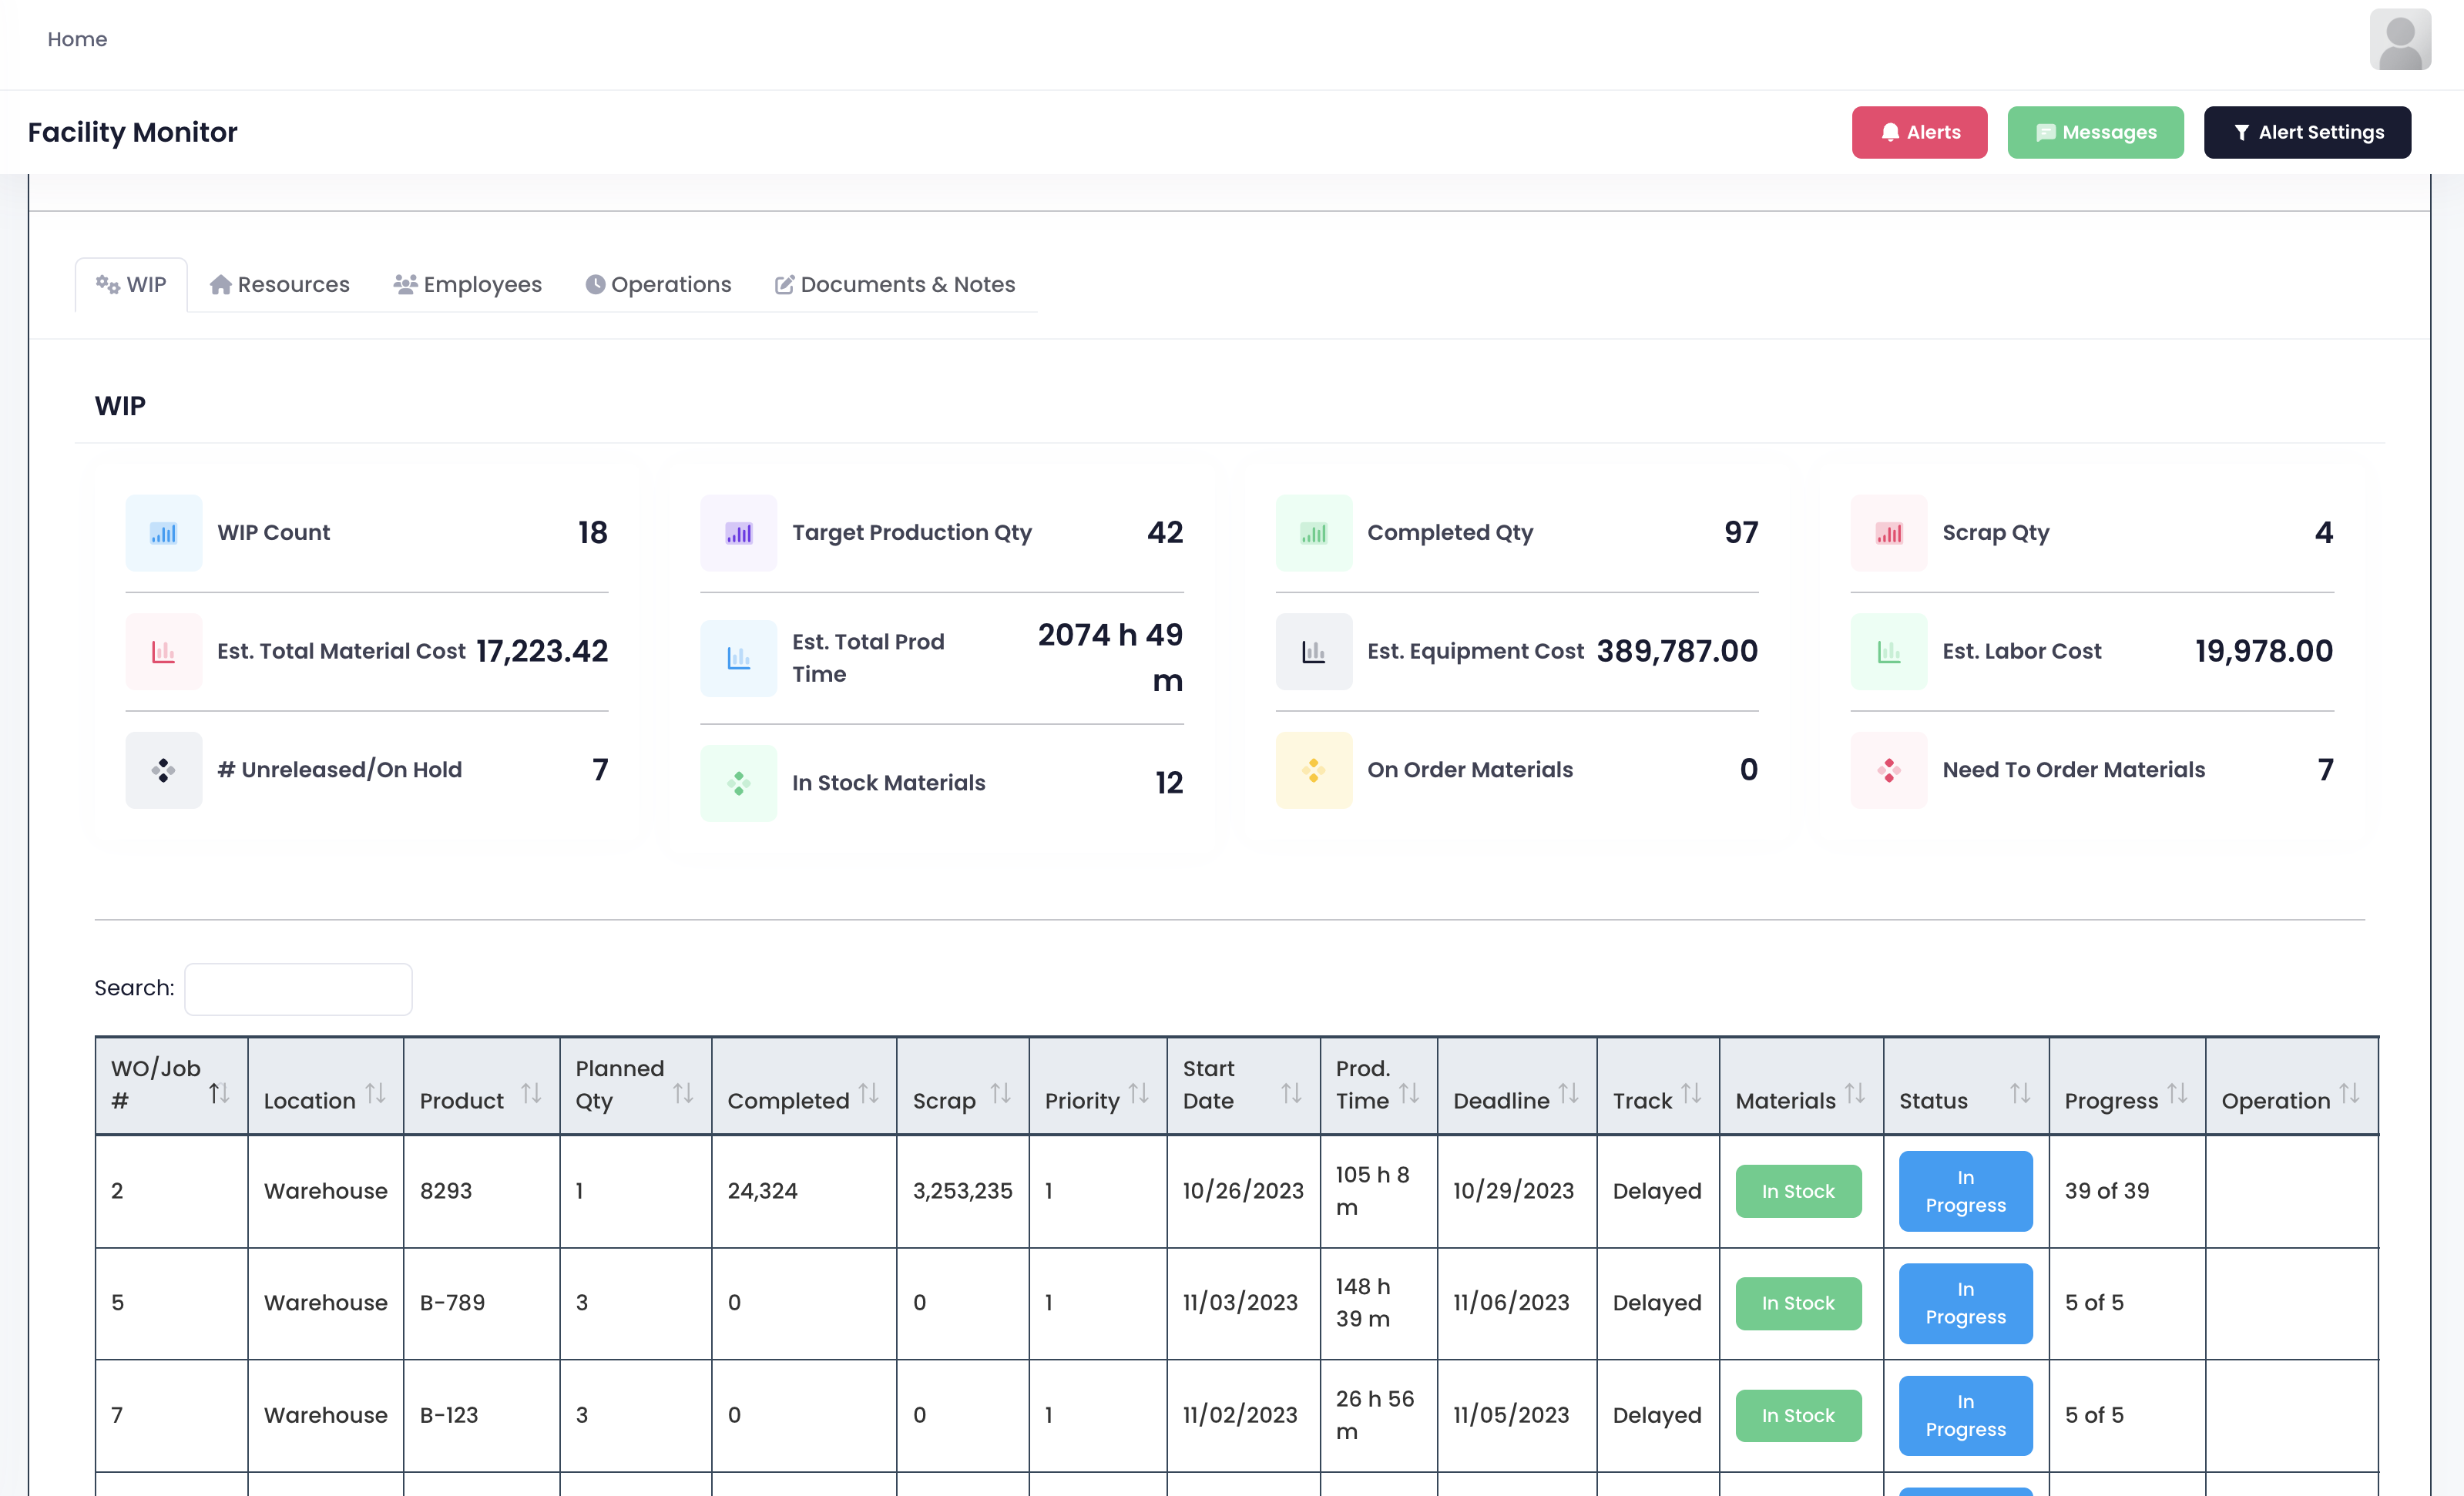
This is the WIP page. 18 jobs currently on the line. Target production is 42 units. Already completed 97 units. Scrapped 4 units.
Material cost is 17.2K. Production time over 2000 hours. Equipment cost 389K. Labor cost 20K. Where the money goes, where the time goes. The system calculates it all.
In the list below, every job shows its location, planned quantity, scrap count, start and end dates, material status, progress. One row tells the whole story.
No Guessing, Just Looking
A lot of people manage factories by walking around, asking a few people, going by gut feel.
This system puts everything on the table. Whether core metrics are on target. What alerts came in today. What causes delays. How much WIP is sitting on the floor. Every number answers the same question: How are we doing right now?
No guessing. One look and you know.