A Tool That Makes Inventory Talk

Summary
×The shelves are full, and the system has all the numbers. But when someone asks, "Do we have enough for next week's orders?" or "When should we reorder this part?" you still end up digging through spreadsheets, making a few calls, and taking a guess based on experience.
That is the awkward truth about most inventory management: the data is there, but the answers are not.
This tool is more than just an inventory list. It turns every item into a flow of information, transforming static data into a smart assistant.
Know What You Have at a Glance
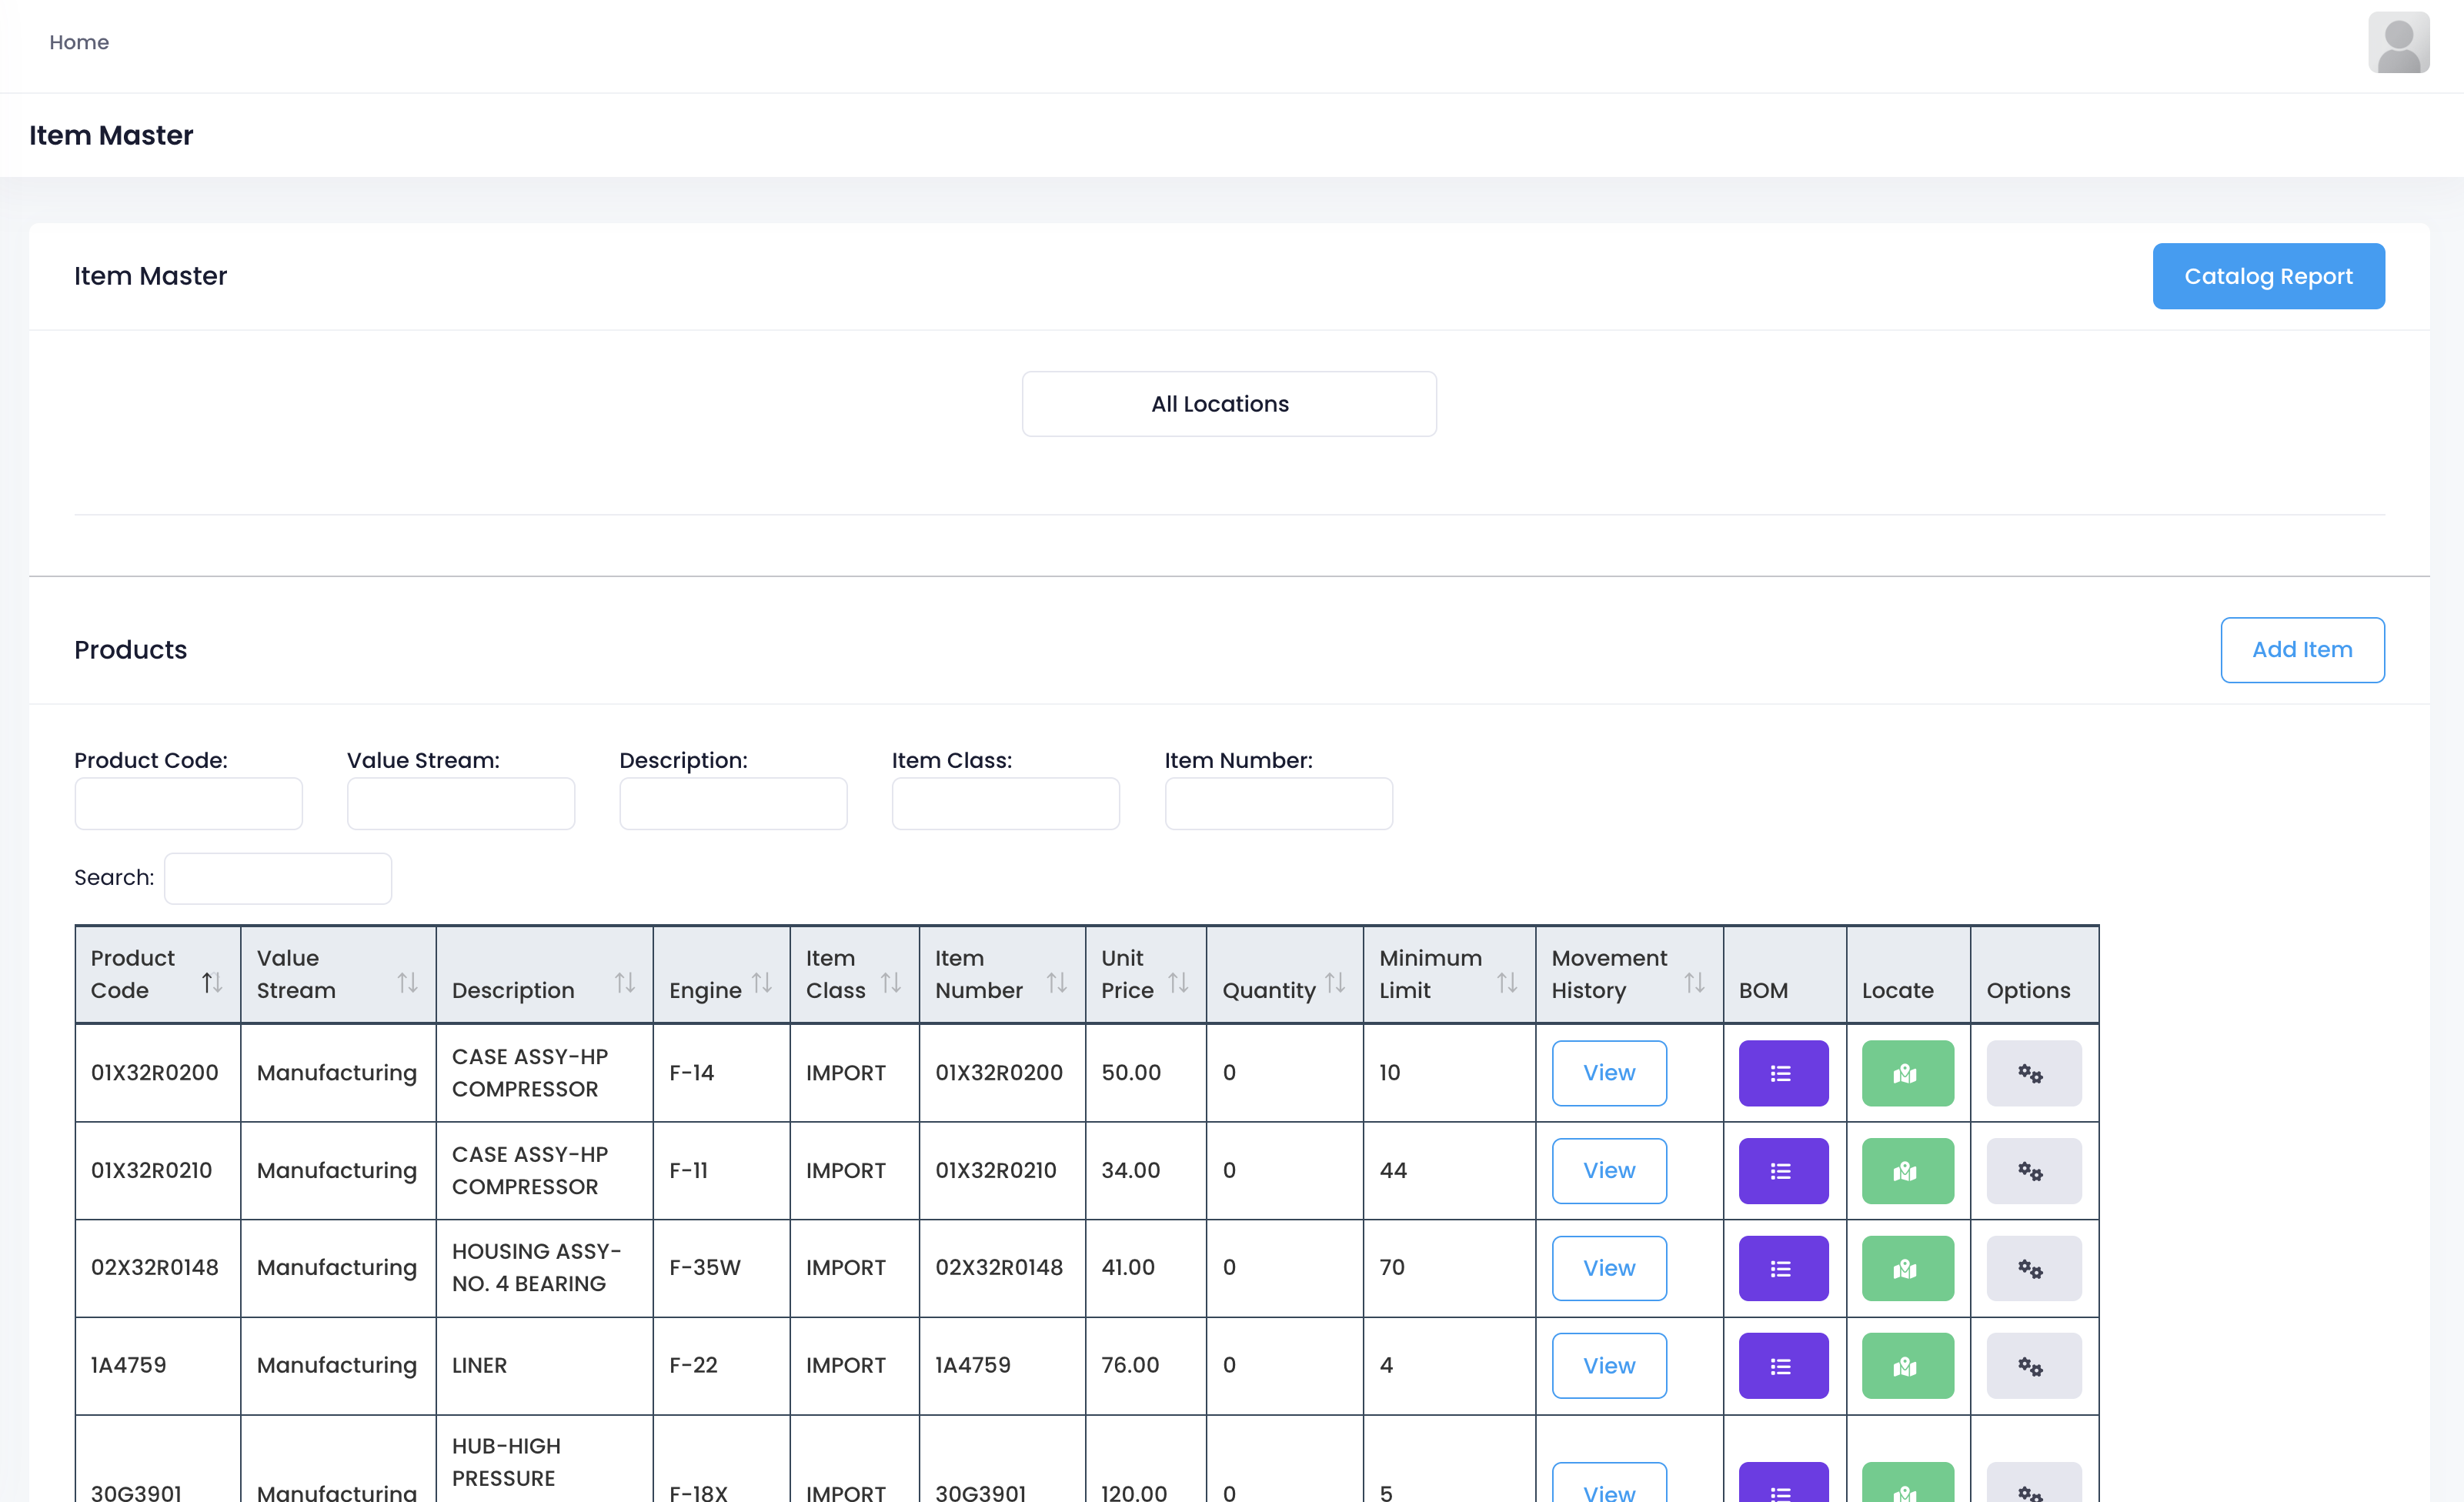
This is the item master page. Every row tells a story:
Product code, value stream, description, applicable model. What this item is used for and where it goes, all clear.
Unit price, quantity, minimum limit. Not just how much you have, but how much is "not enough”.
Movement history, BOM structure, location tracking. From source to destination, fully traceable.
Ordinary inventory systems tell you "what you have”.
This system tells you "is it enough, is it short, where it came from, where it goes”.
Every Item Has an Identity
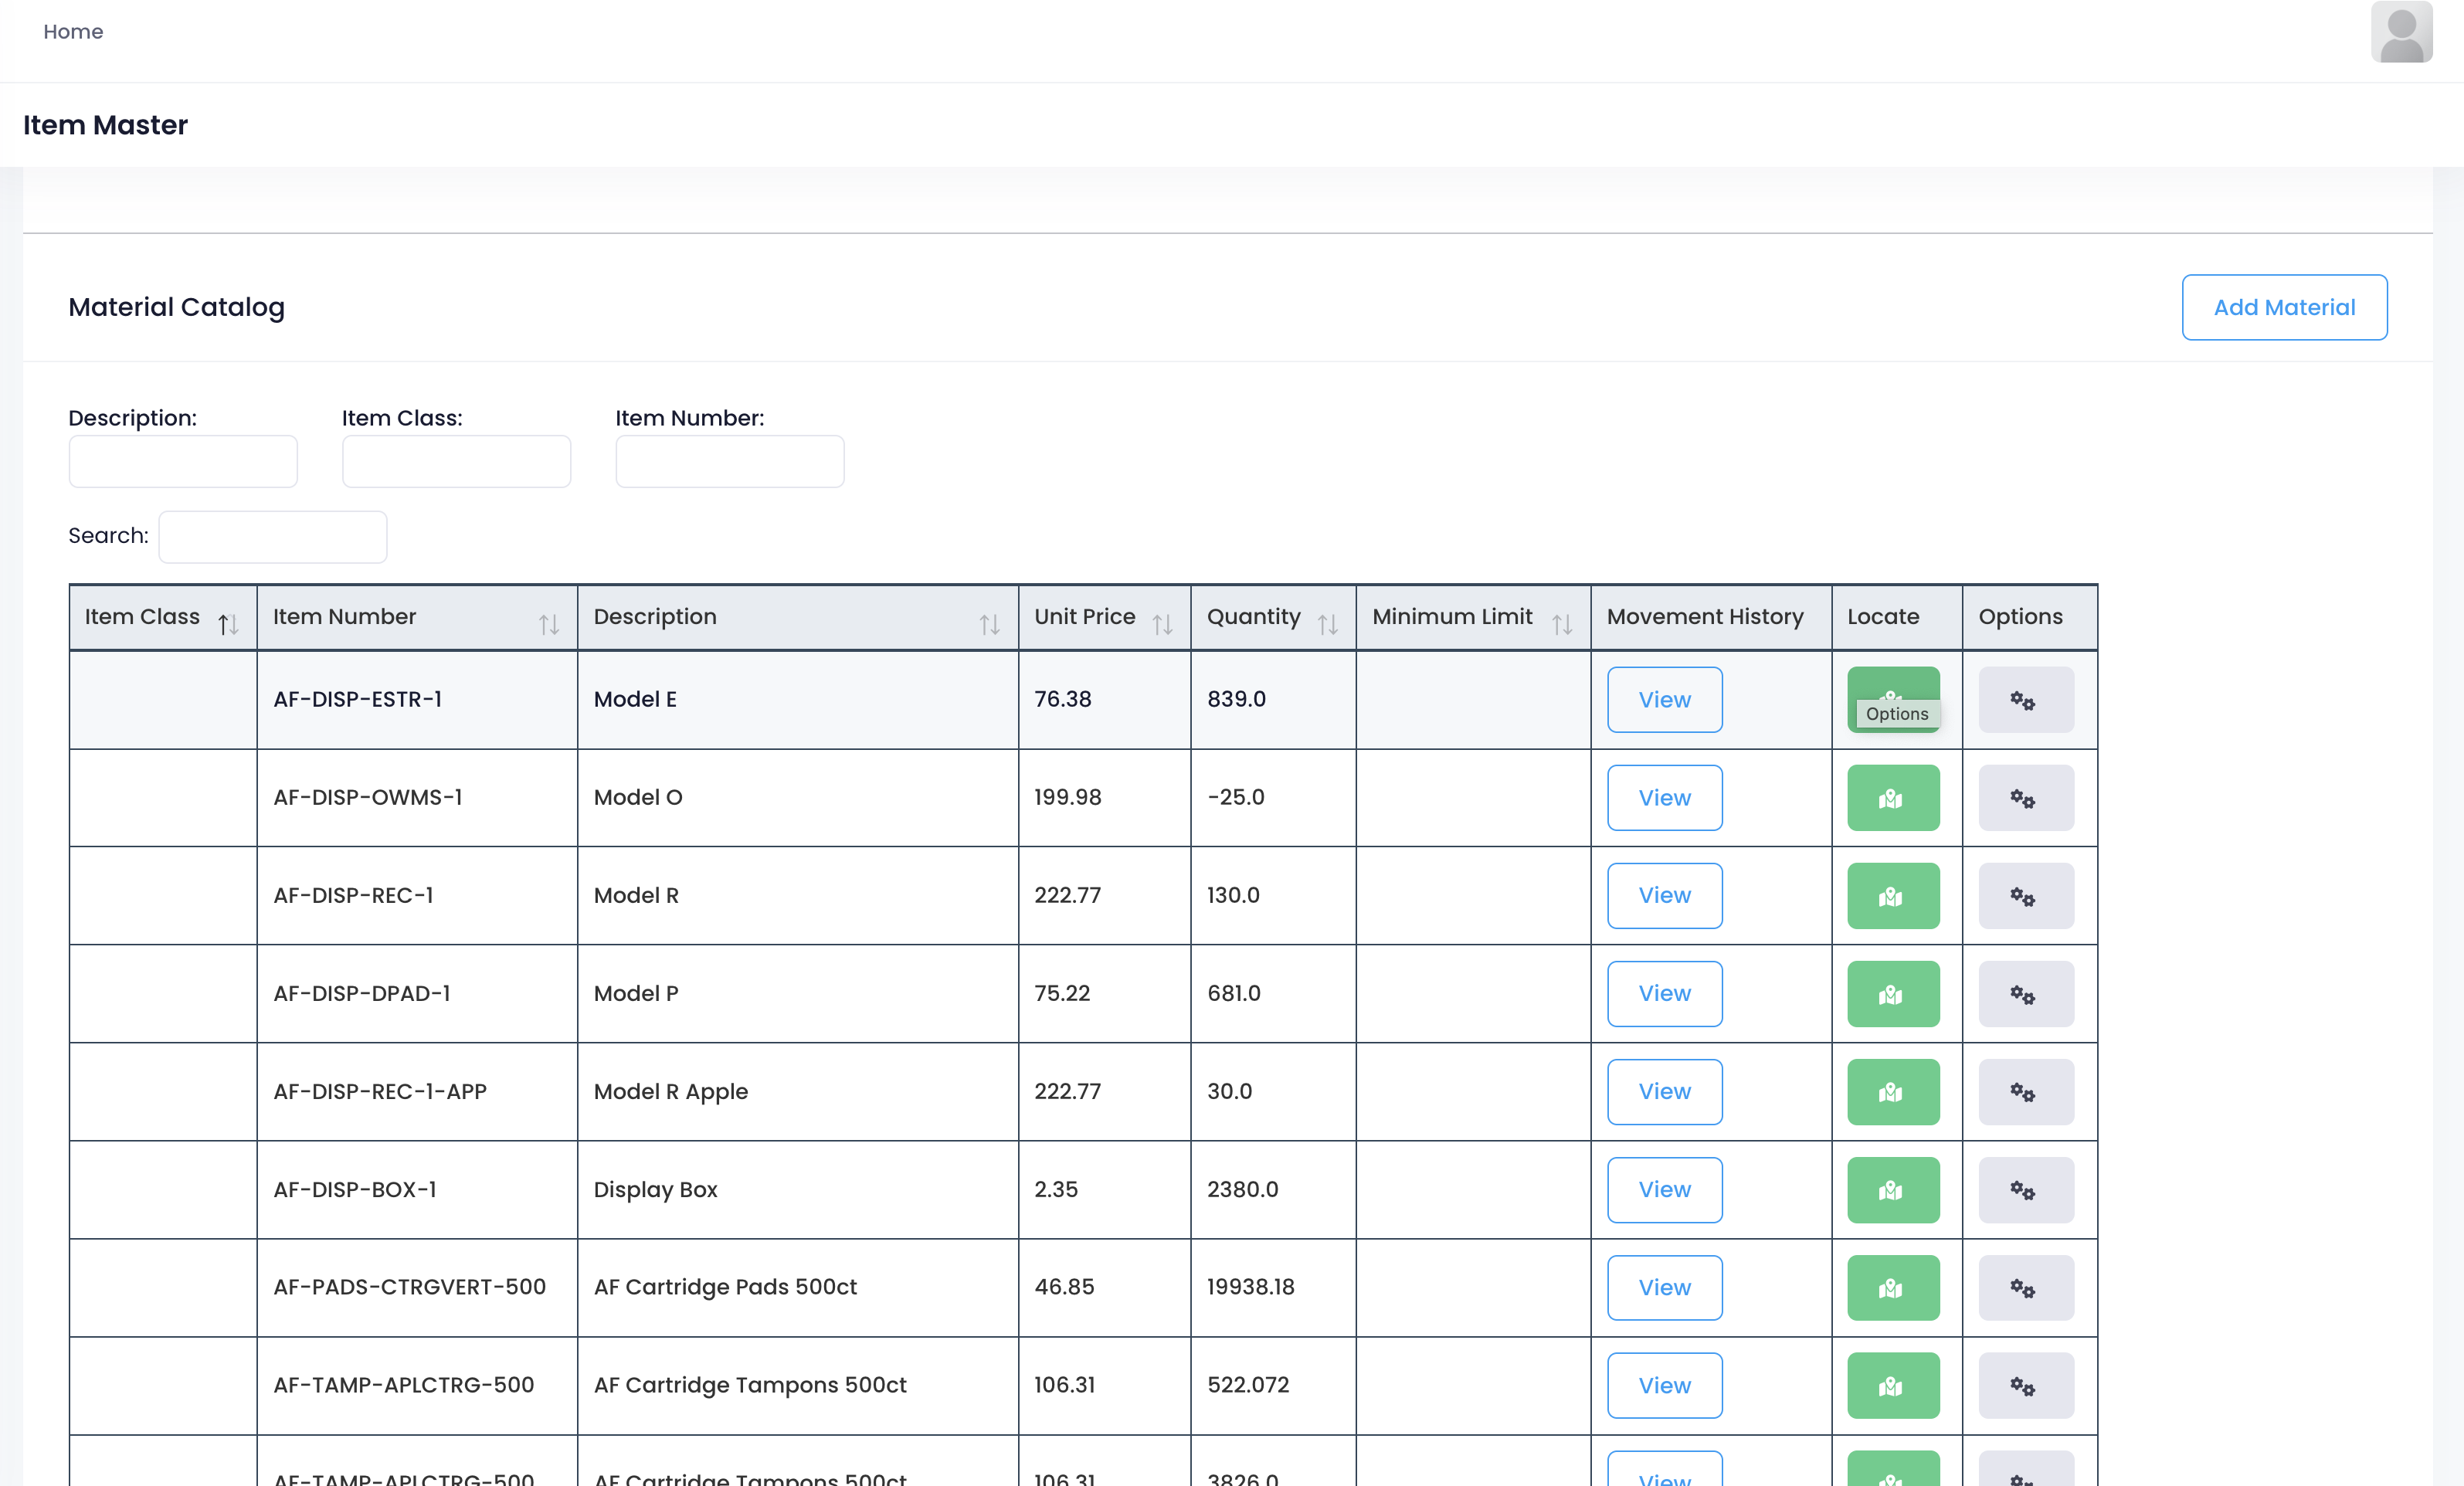
Looking at the material list from another angle, the level of detail is finer here.
Each record is like an ID card: item class, number, description, unit price, quantity. Even accurate to two decimal places, so every transaction is traceable.
Negative inventory shows up directly. Which item was over issued, which one forgot to be received. Spot it at a glance.
Take It Apart to Understand the Complexity
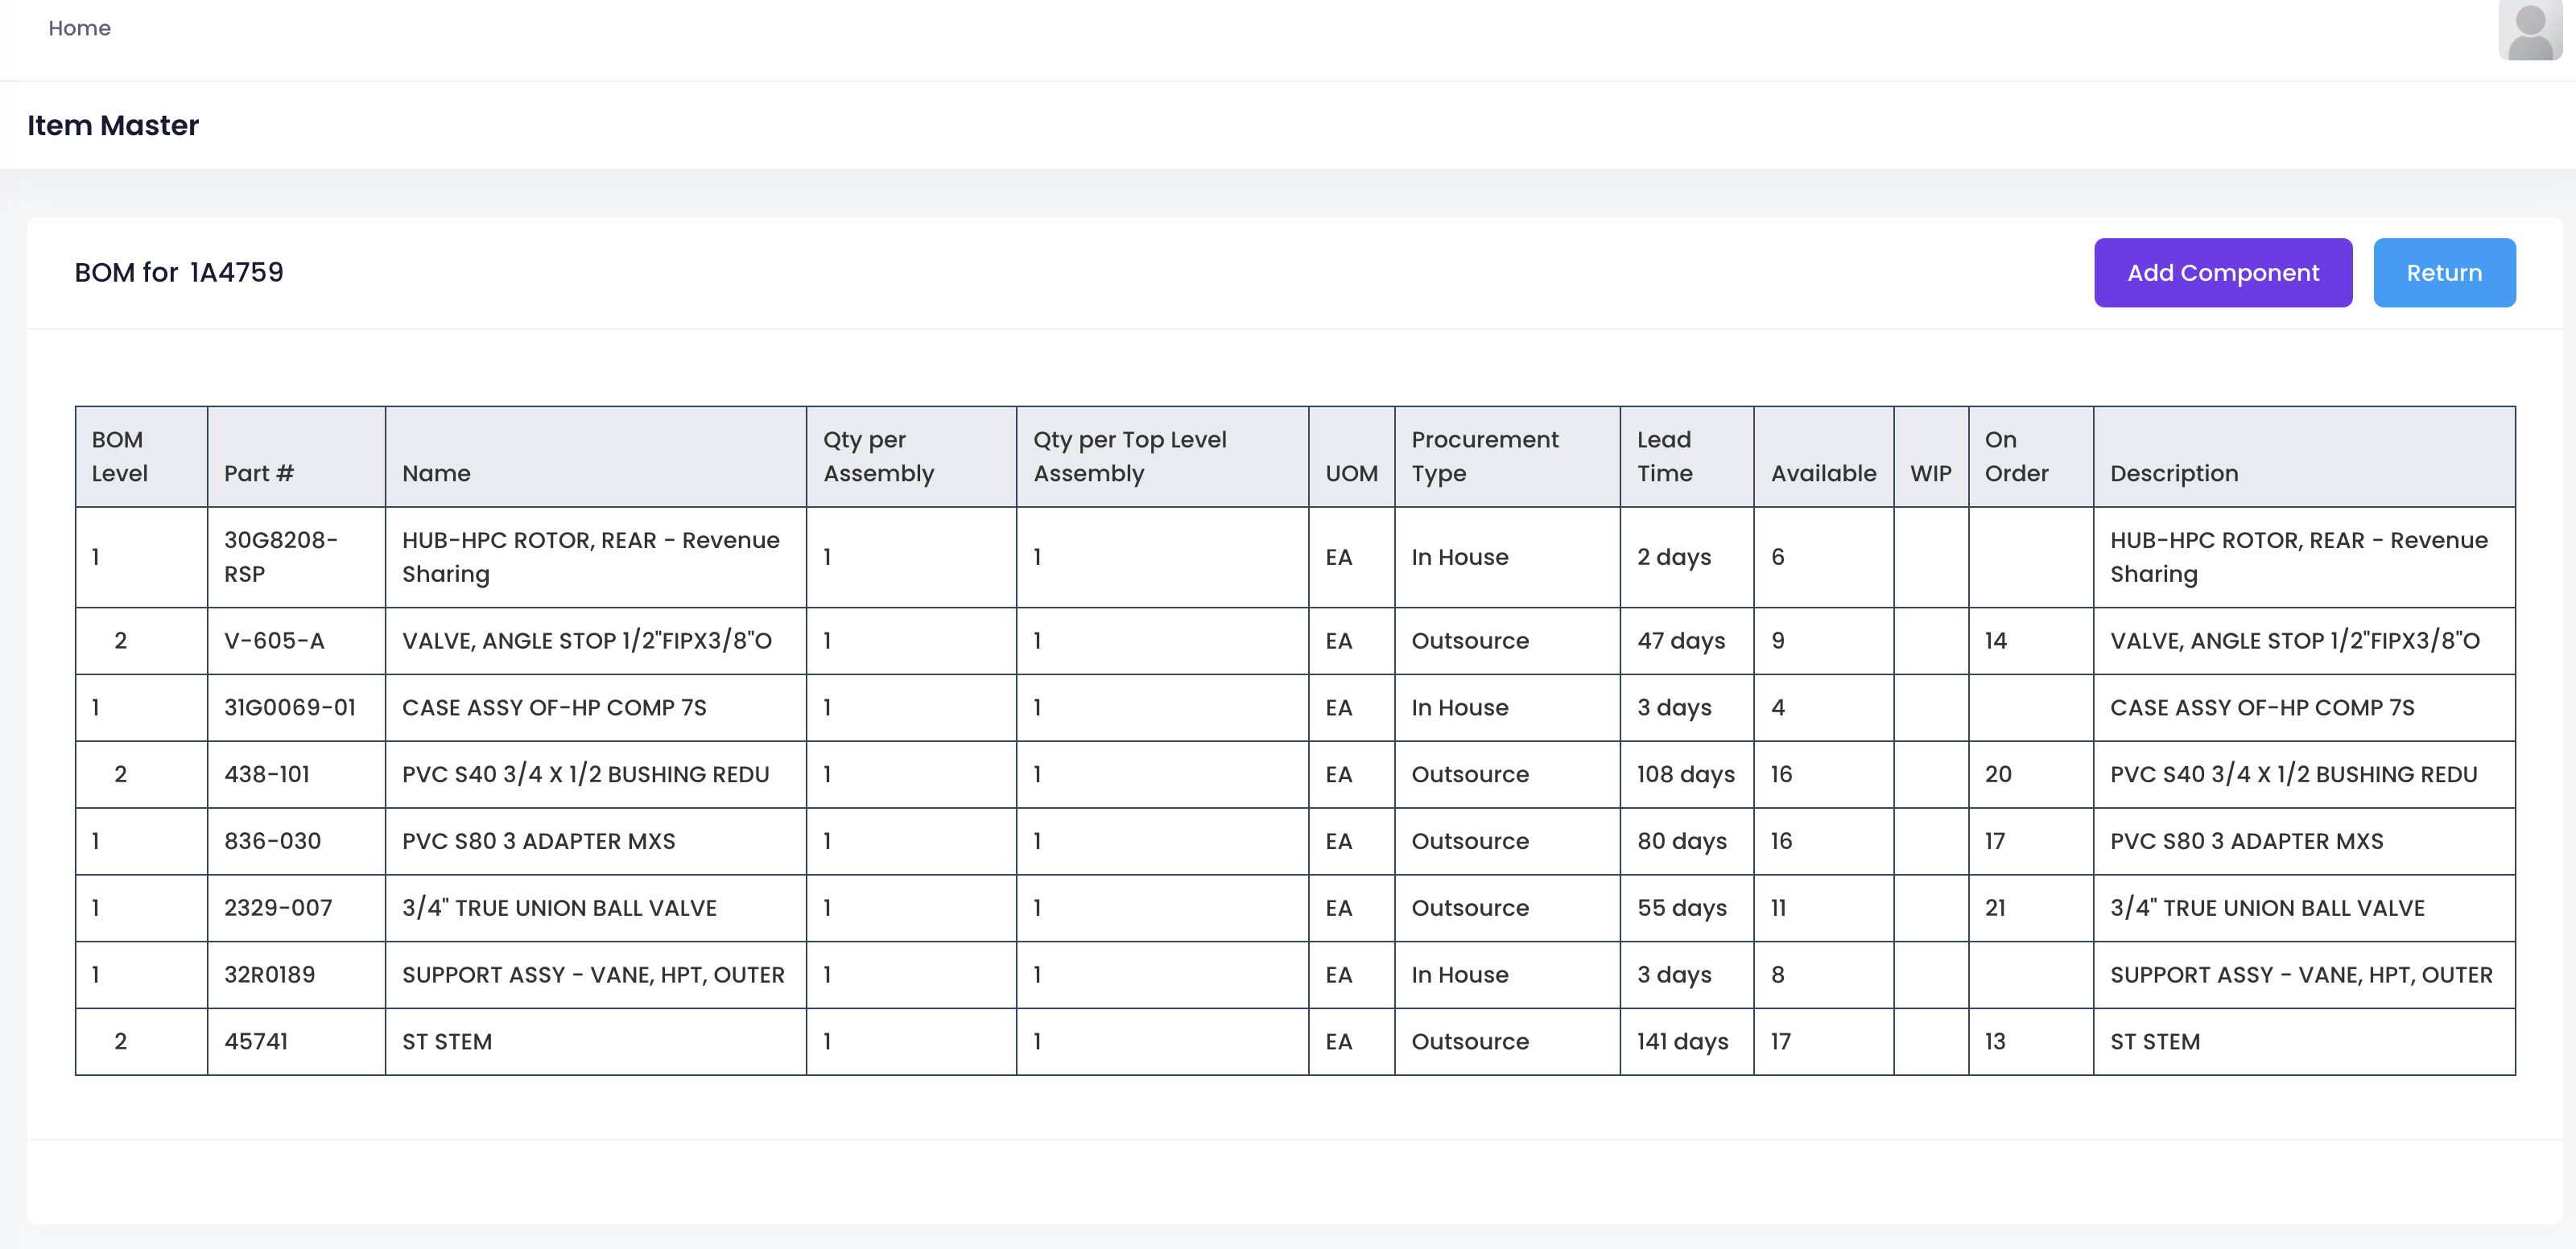
This is the core part: the BOM, or bill of materials.
Take a finished product apart, and you might see a complex tree structure. What is level one, what is level two, which part belongs to which. All crystal clear.
Level relationships: 1 is the assembly, 2 is the component. Structure is clear.
Make or buy: Sourcing strategy is directly visible.
Lead time: From 2 days to 141 days. Production planning depends on it.
On hand, in progress, on order: What you have, what you are making, what you have ordered. All in one table.
Why do some orders take three months? Look at the lead times and you will understand.
Why can't you ship even with enough stock? Look at the BOM structure and you will know.
What Makes This Different
Most systems are good at recording. This one is good at revealing.
It shows you the gaps you didn't see. It answers the questions you forgot to ask. Not by adding more data, but by making the data you already have finally make sense.
From static lists to living information. From counting to knowing.