The Digital Leap of Manufacturing Operations

Summary
×In the traditional manufacturing environment, data is often scattered across functional departments, forming isolated information silos that rarely connect.
The purchasing team tracks orders in Excel. Warehouse staff verify materials with paper lists. Production orders are pinned to workshop walls, waiting for workers to claim them. Engineers flip through folders to find the latest BOM version. Planners manually calculate next week's production across multiple spreadsheets. Managers wait for various reports to piece together a full picture of the factory.
Every link generates data. But the data does not communicate with each other.
Put every core operation on one platform. Purchasing, inventory, planning, production. All data flows in real time. All processes talk to each other. No more silos. No more waiting.
Purchase Orders: From Paper Trail to Digital Closed Loop
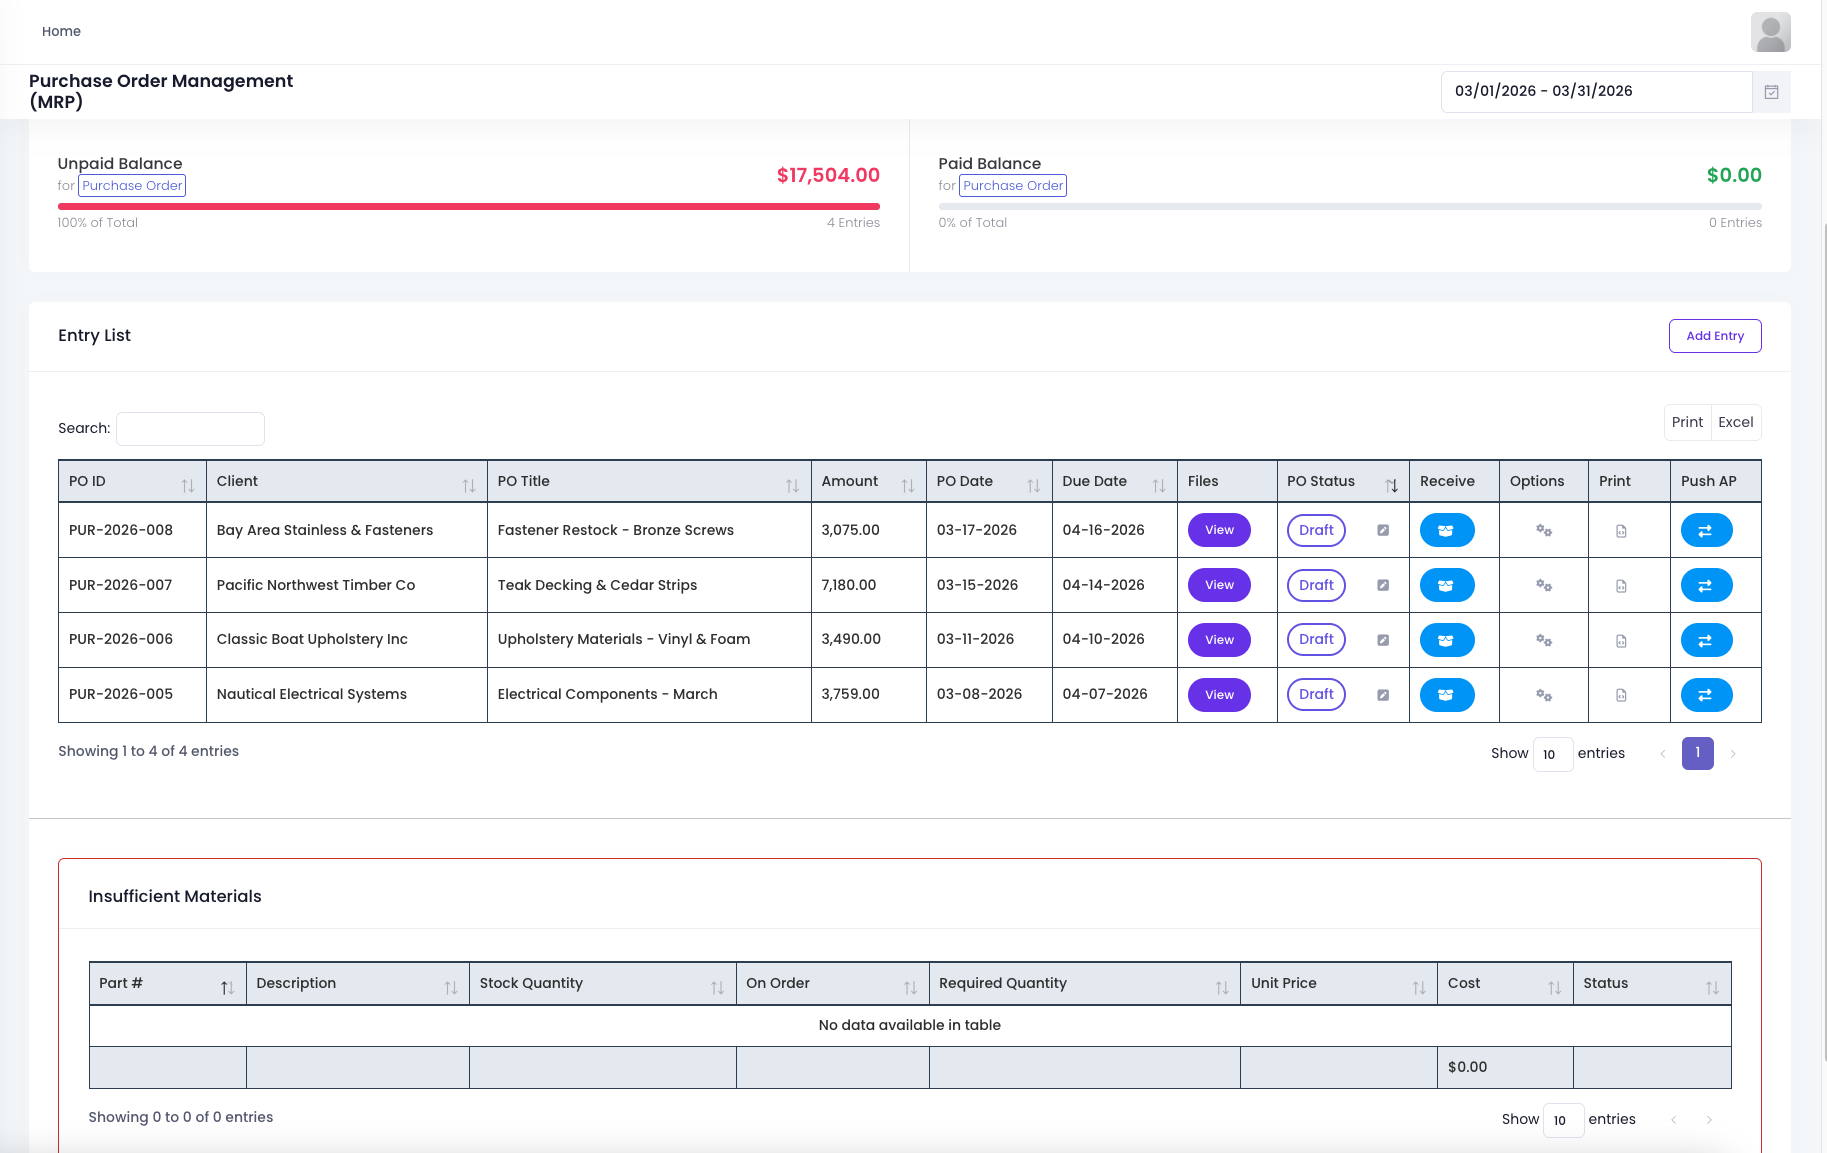
The procurement management interface clearly displays four open orders, covering fasteners, decking materials, upholstery fabrics, and electrical components. Total outstanding amount is $17,504.
Each order carries a complete information chain: supplier, amount, order date, due date. Users can view attachments with one click, complete receipts, or push to accounts payable. From procurement initiation to payment settlement, the entire process runs in a digital closed loop.
The reserved alert area below is gradually breaking down the data barrier between procurement and inventory.
Inventory Master Data: From Static Lists to Dynamic Views
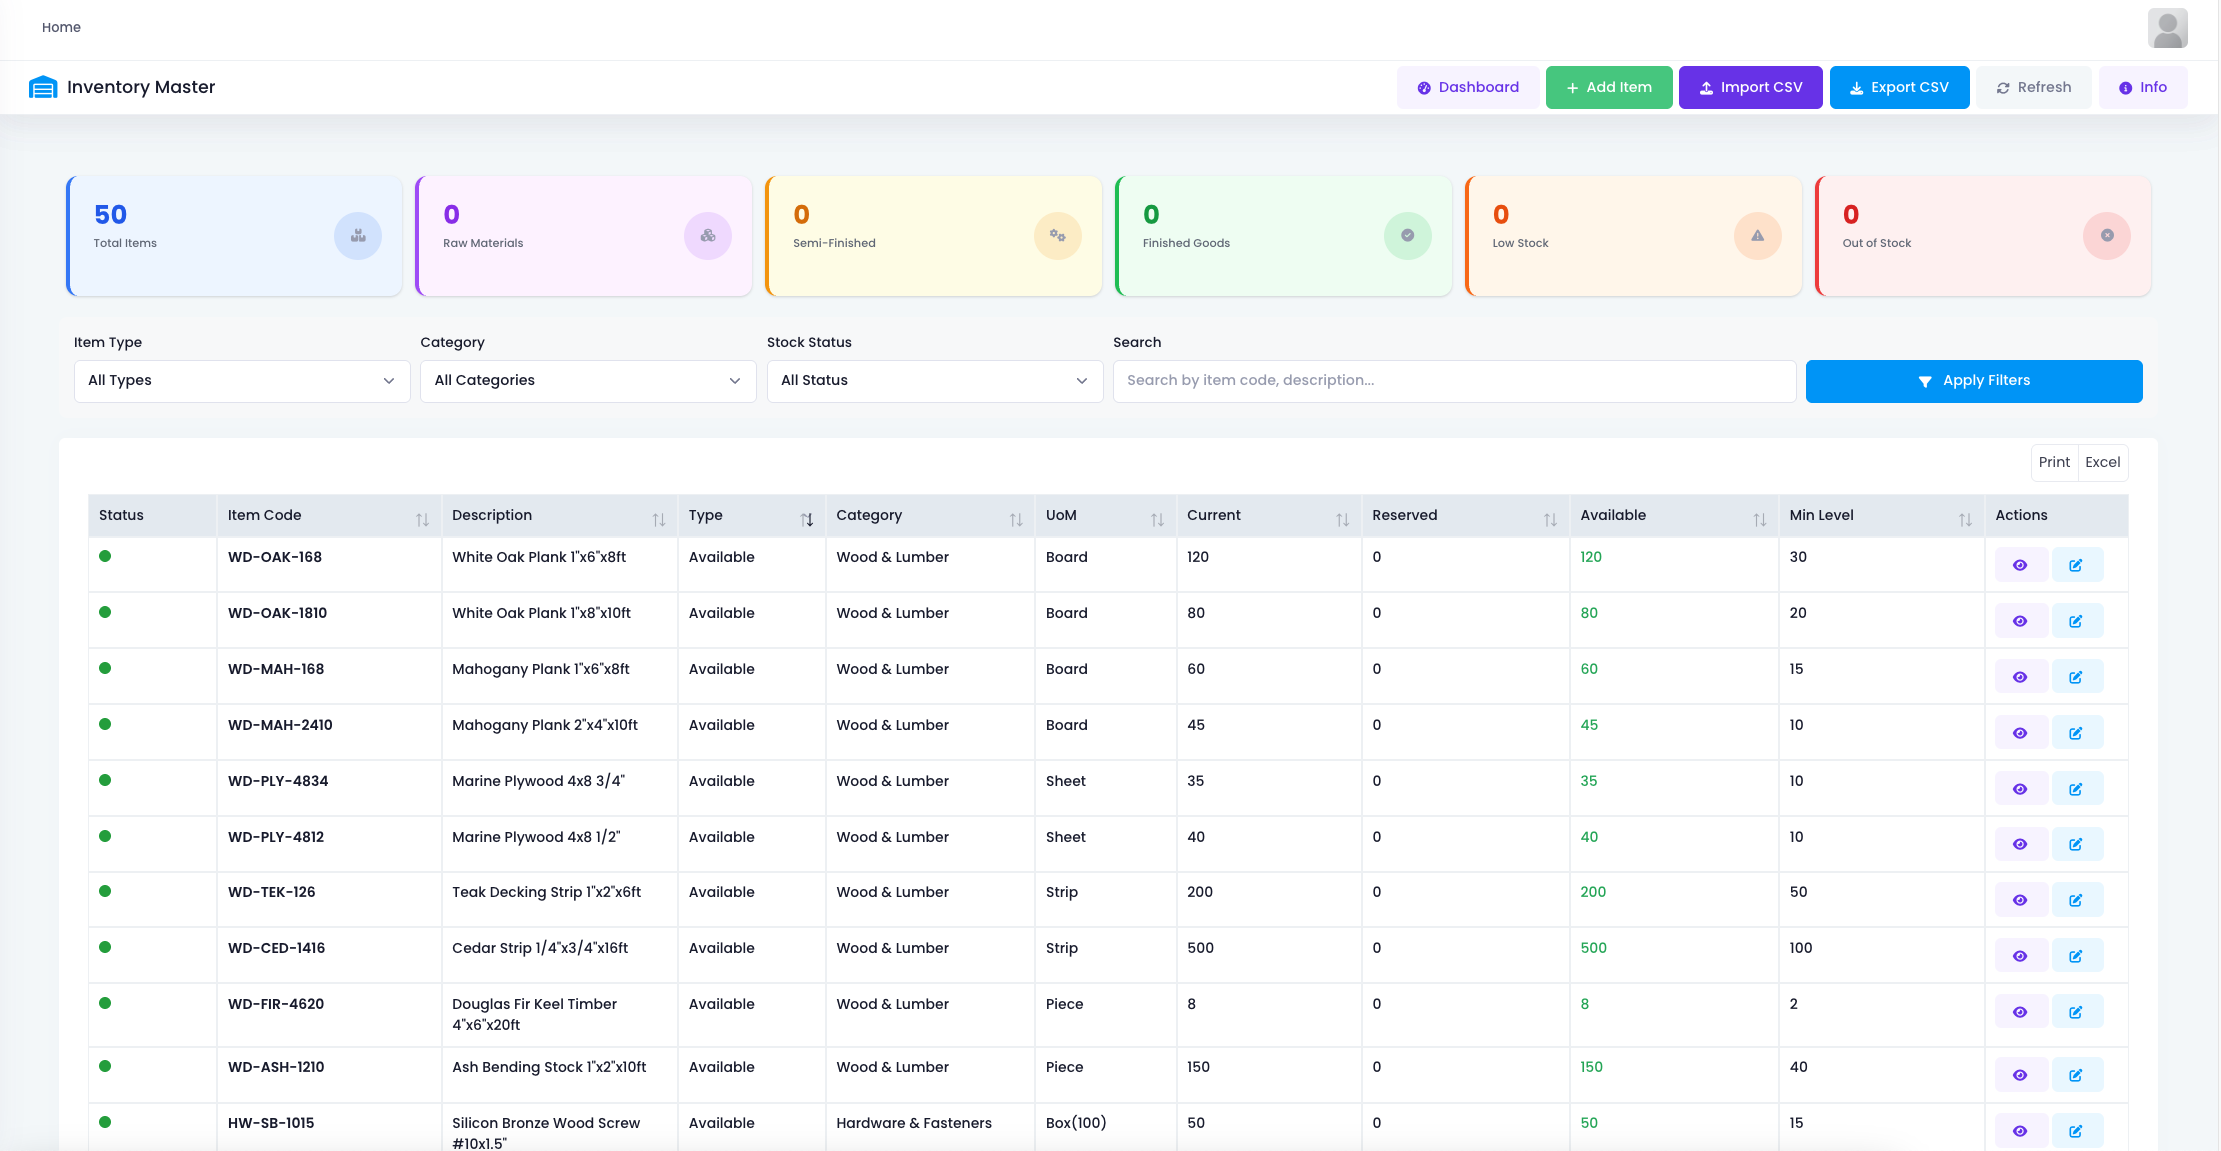
The inventory master page manages 50 materials, categorized by raw materials, semi finished goods, and finished products.
Each row shows not only current stock but also reserved quantity, available quantity, and safety stock levels. Take white oak planks: stock 120, available 120, safety stock 30. Bronze wood screws 50 boxes, available 50, safety stock 15.
Items falling below safety stock are immediately visible. No need to wait for month end counts to trigger replenishment alerts.
Bill of Materials: From Scattered Documents to Structured Data
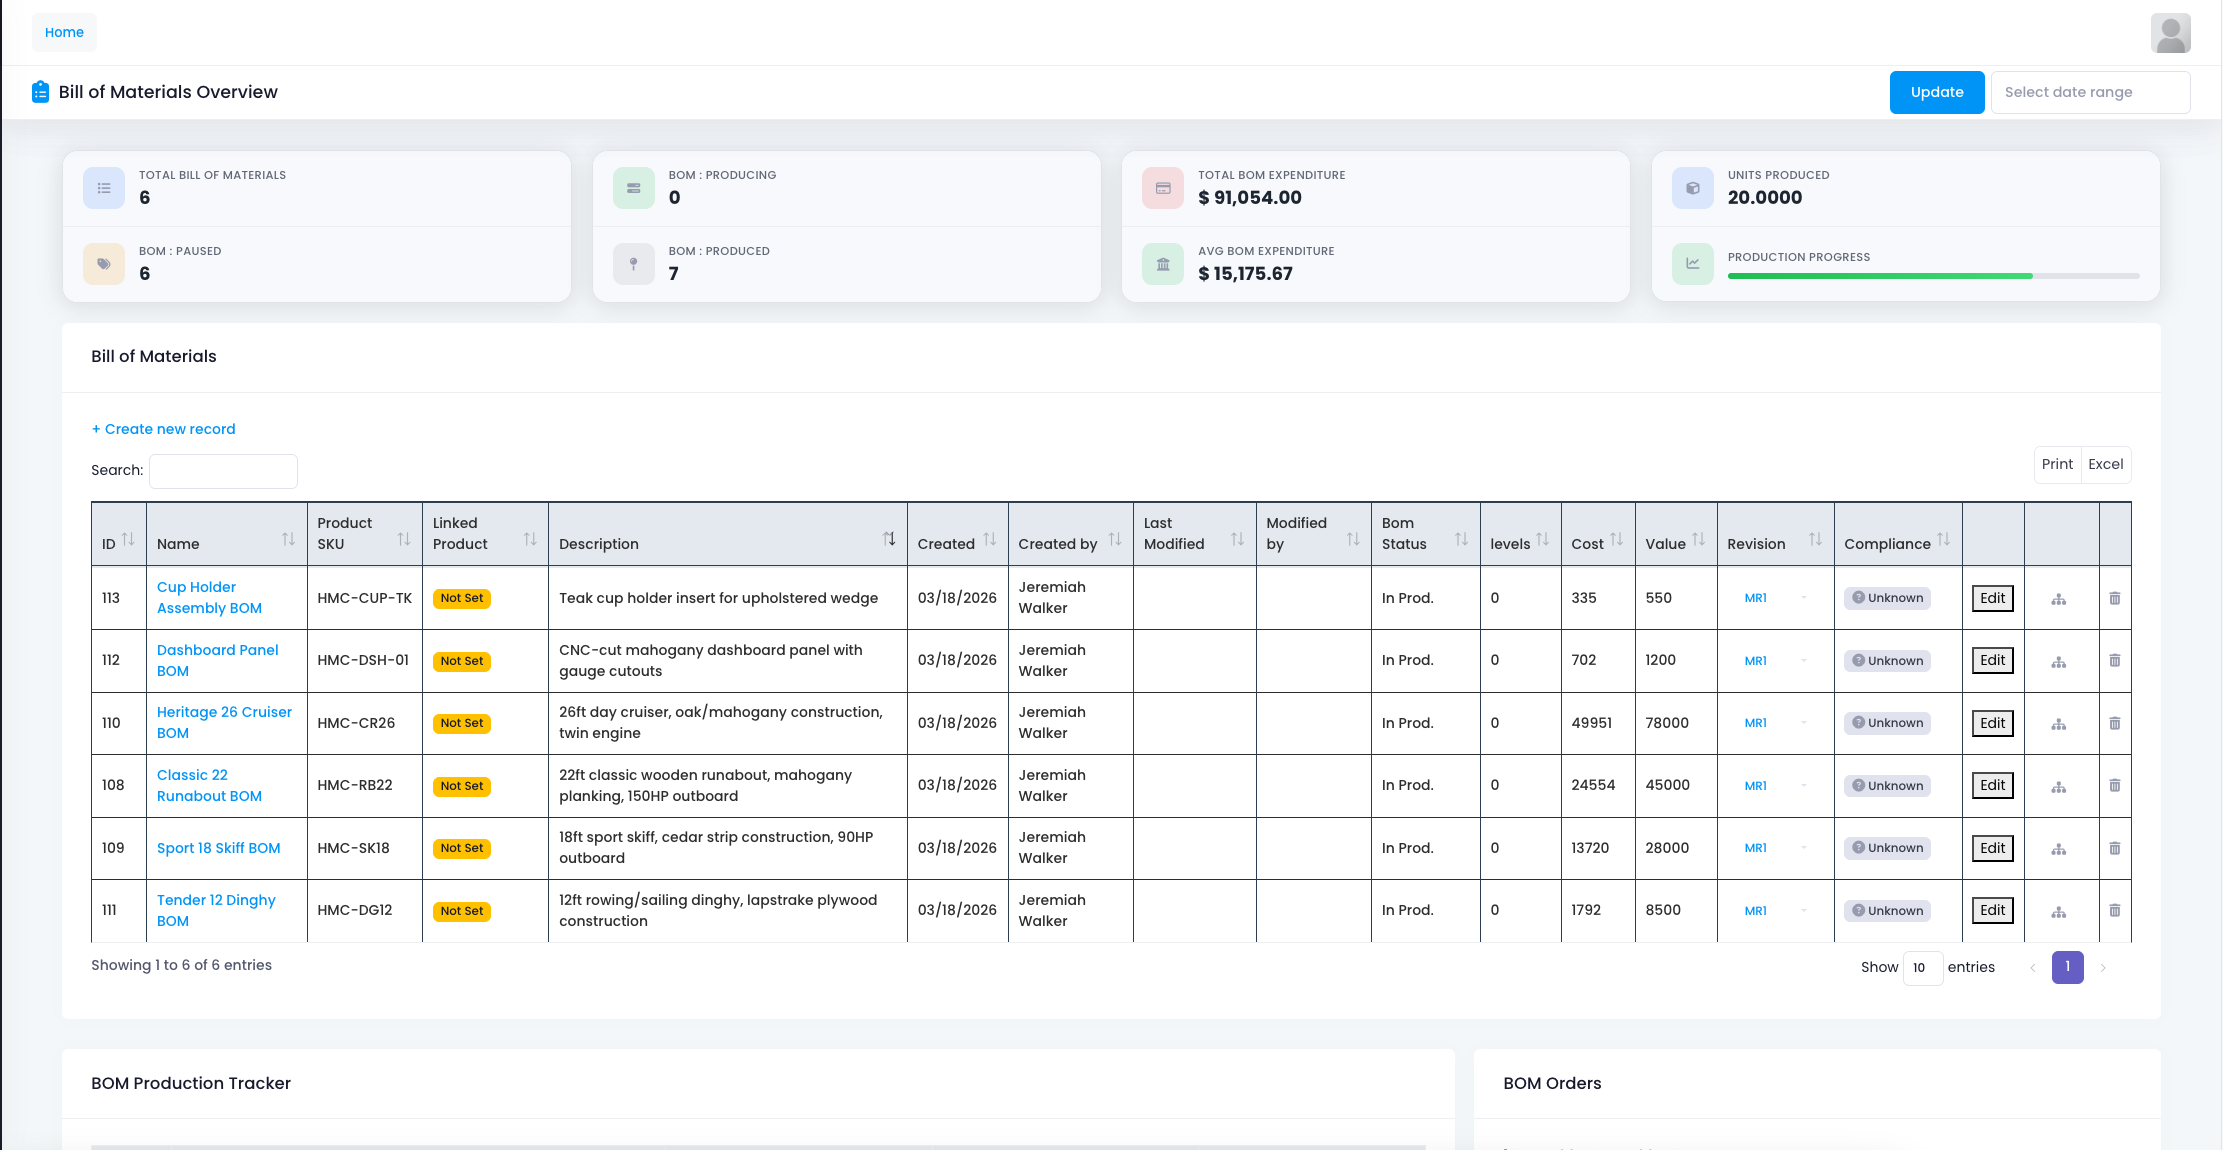
The BOM overview page centralizes six bills of materials, covering products from cup holder assemblies to a 26 foot cruiser.
Costs range from $335 to $49,951, with corresponding values from $550 to $78,000. Each BOM clearly presents material composition, level relationships, standard cost, and estimated value. Engineers no longer dig through different file versions. Procurement and production can collaborate based on the same data.
Master Production Schedule: From Gut Feel to Data Driven Decisions
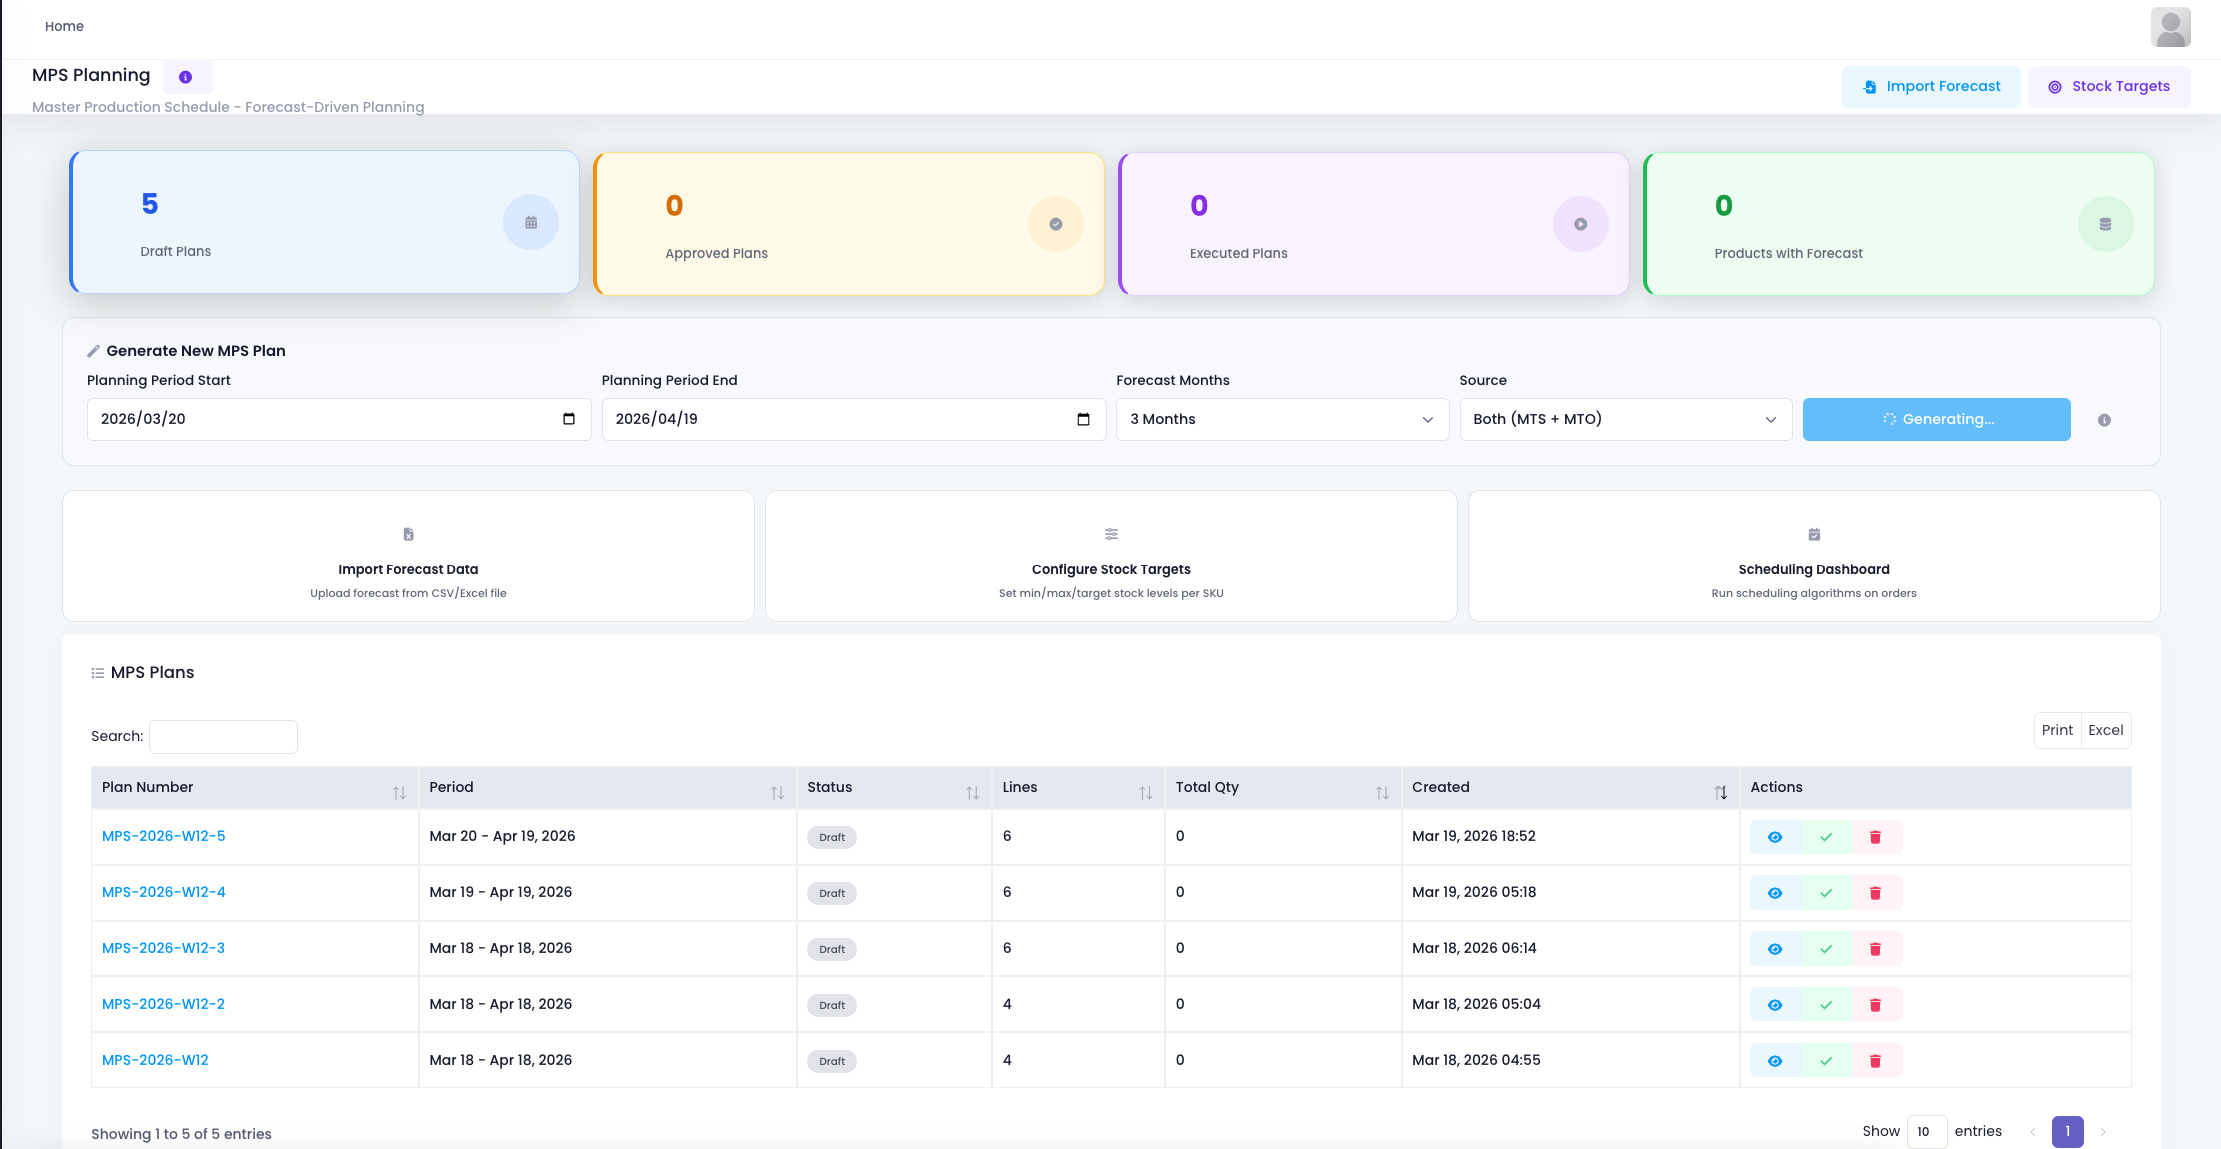
The MPS planning page organizes production for the coming month. Currently, five draft plans span from March 18 to April 19.
Function entries on the right support generating new plans, importing forecast data, and configuring inventory targets. Once forecast data is fed in, the system automatically calculates net requirements and suggested quantities, turning planner intuition into quantifiable data decisions.
Plan Details: From Summary to Line by Line Breakdown
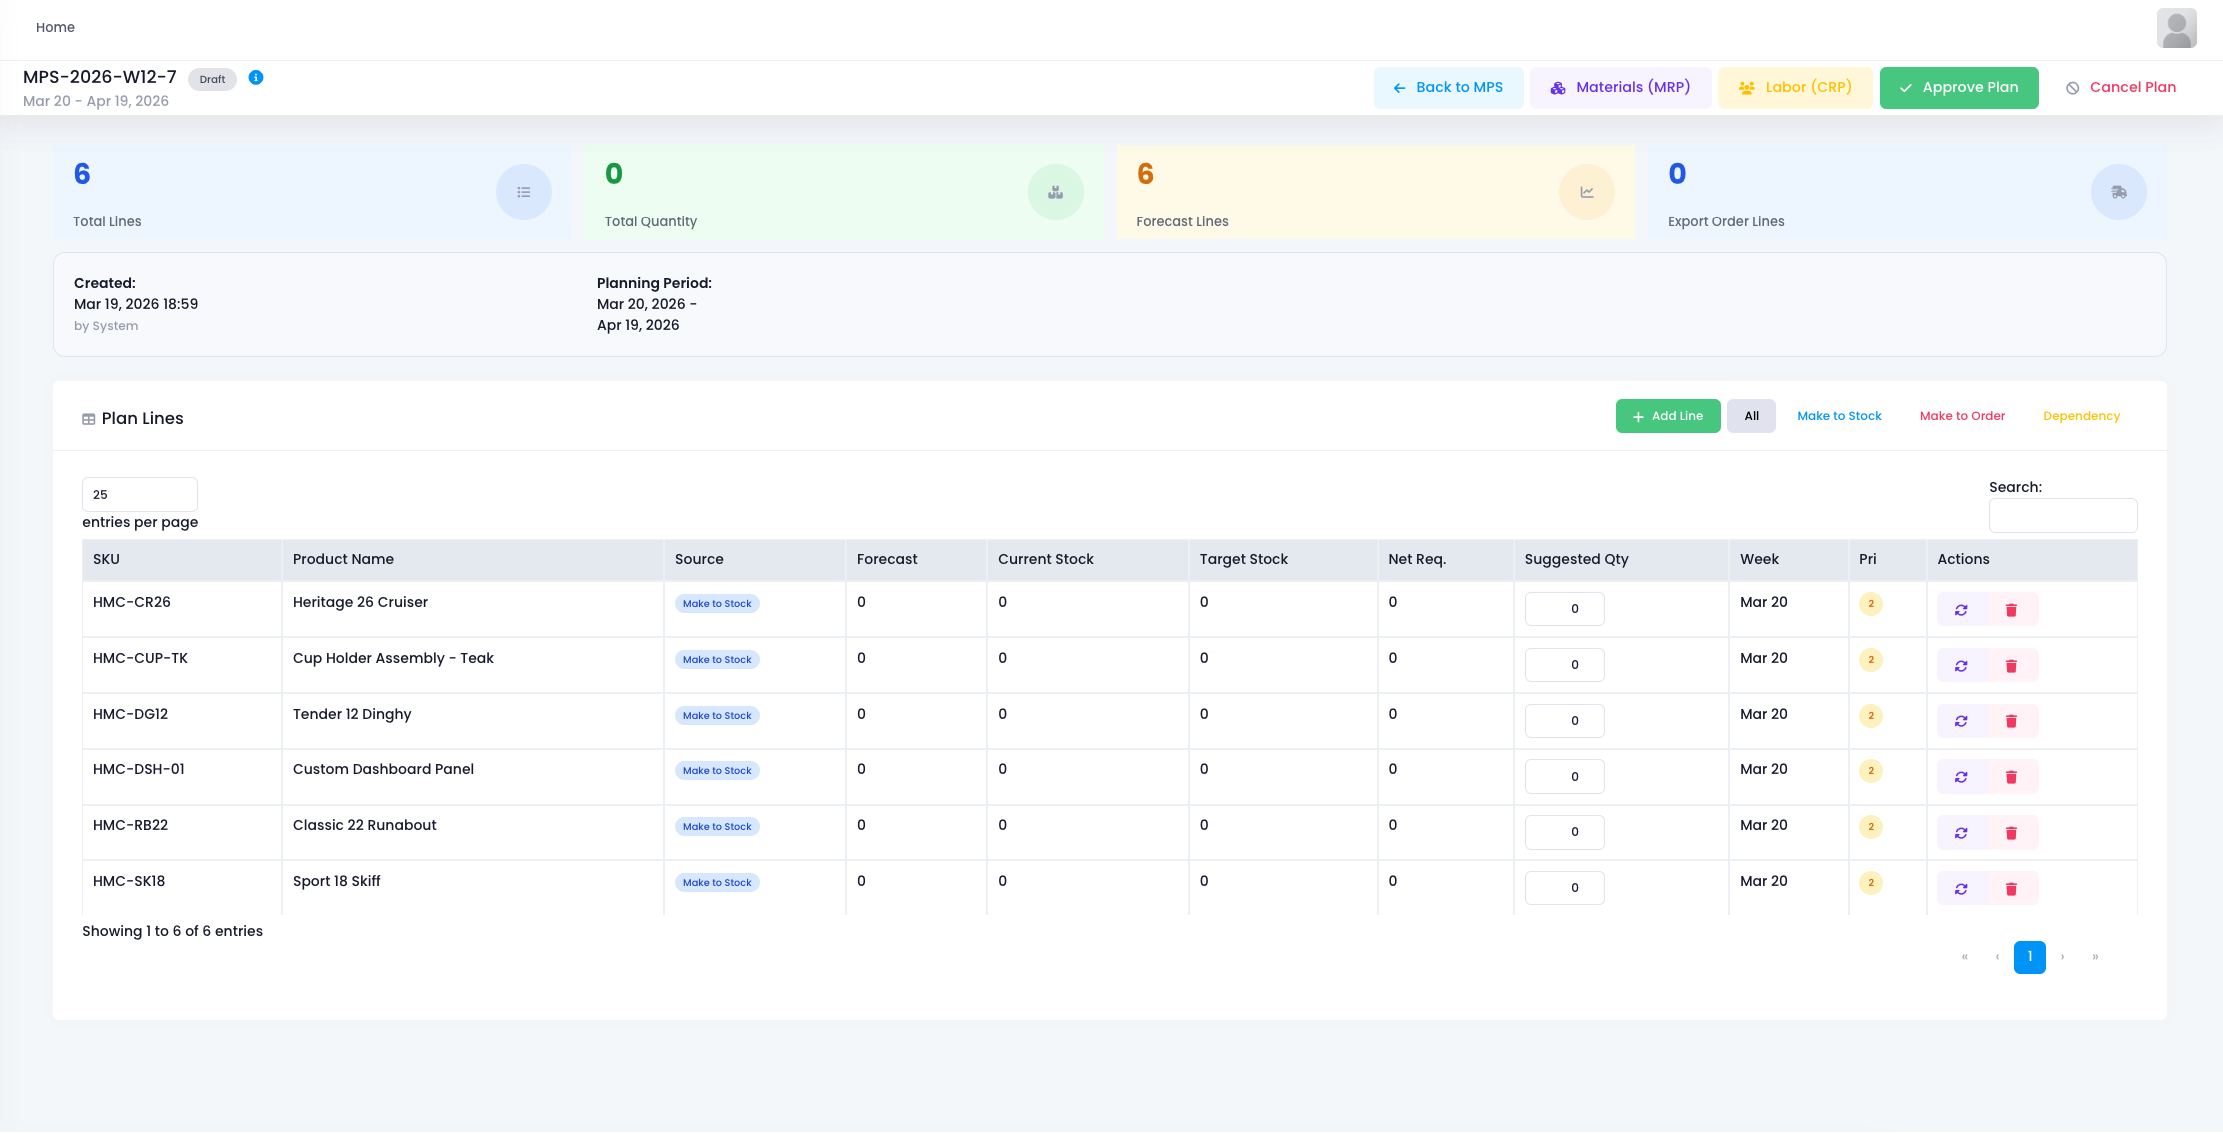
Click into any plan. The detailed view appears. Six products line up, each showing SKU, product name, demand source, forecast, current stock, target stock, net requirement, suggested quantity, planned week, and priority.
When forecast data is complete, each row becomes a specific production instruction, answering clearly: what to make, how many, and when.
Routing: From Order Level to Operation Level Tracking
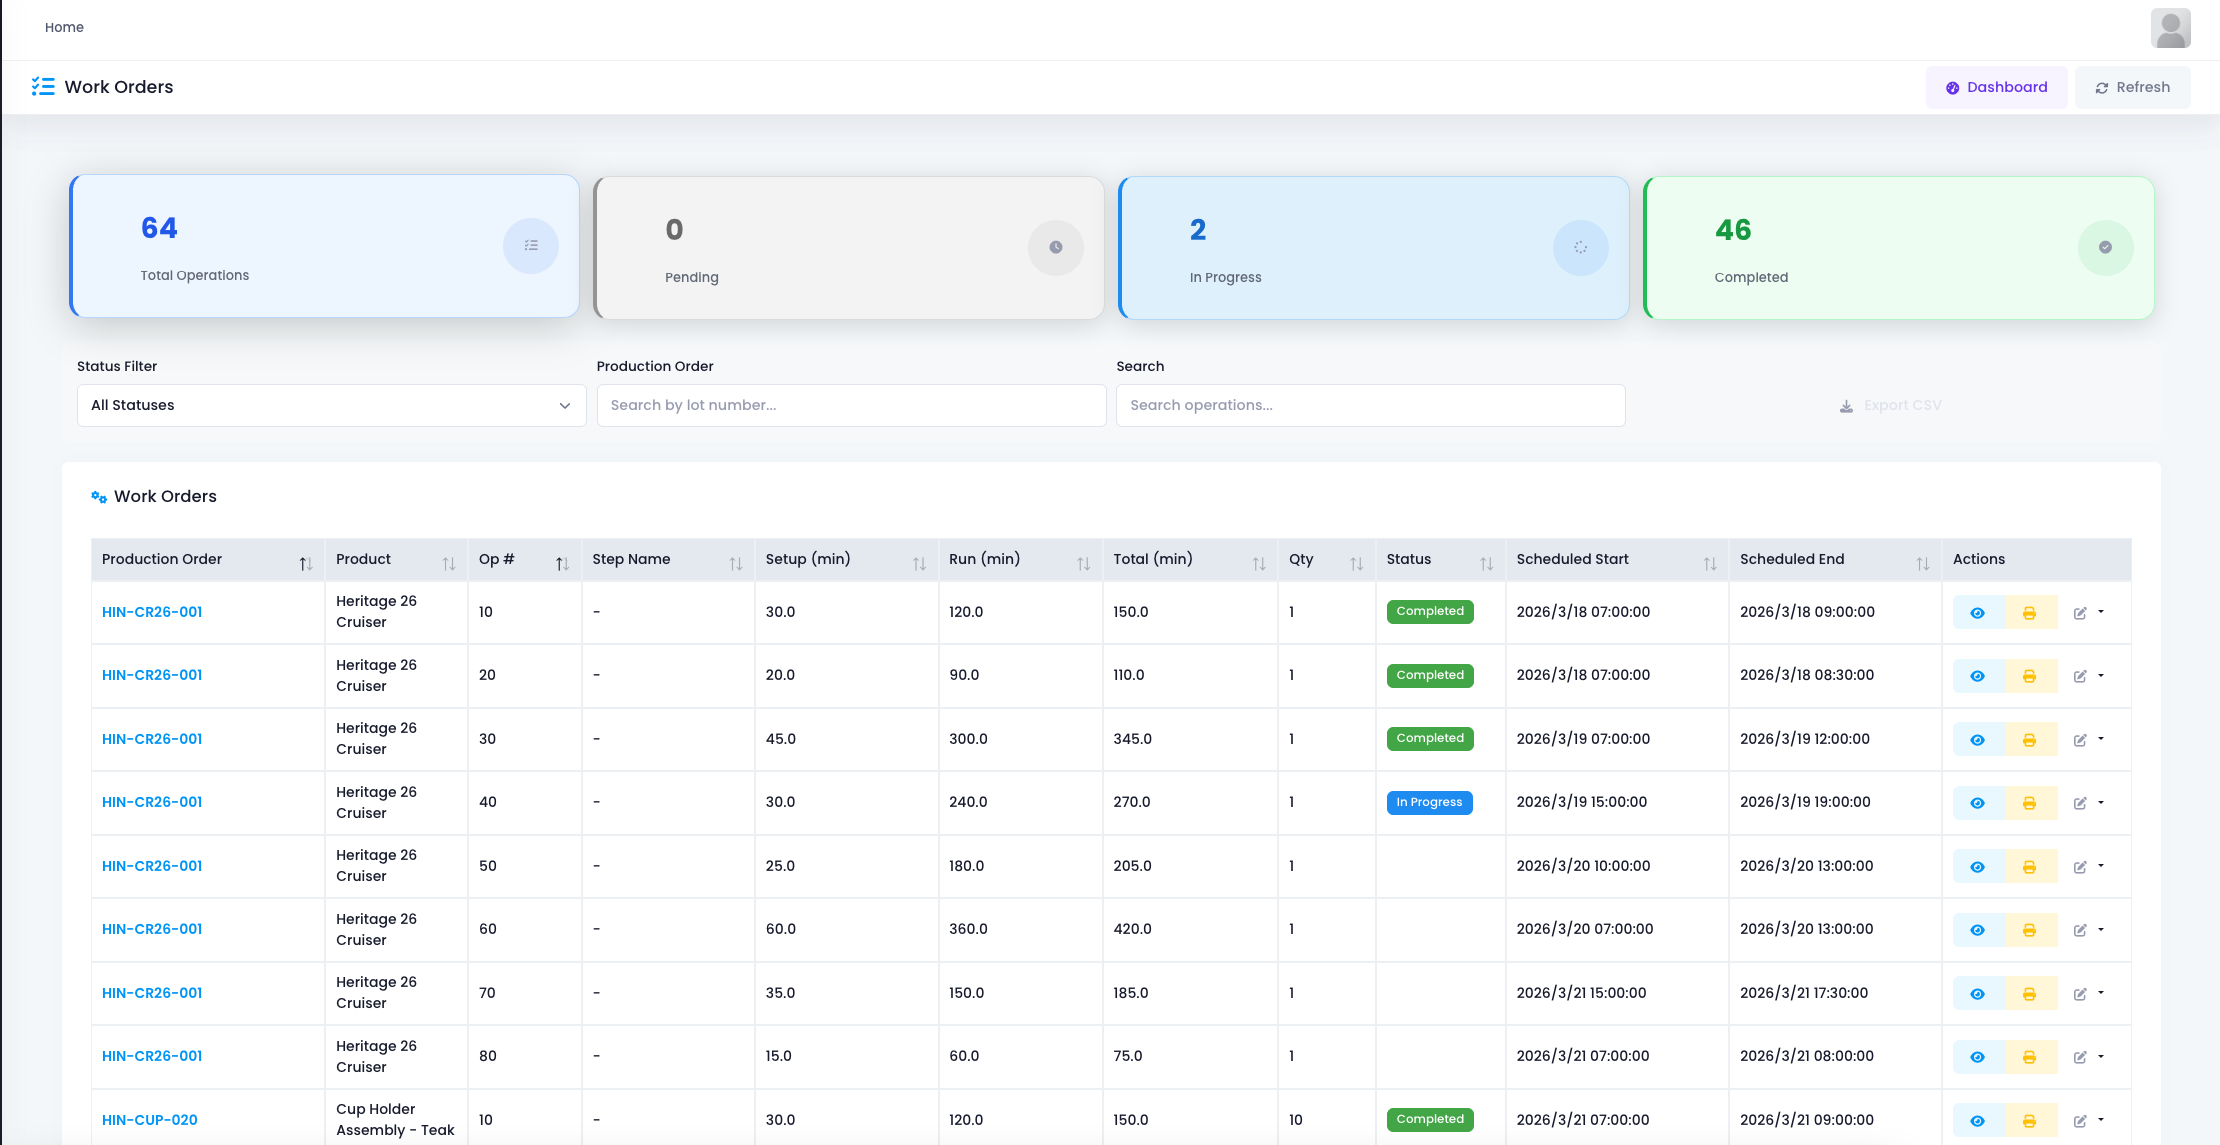
The work order list page breaks down the build of a 26 foot cruiser into eight operations.
Each operation records setup time, run time, total hours, planned quantity, and execution status. Operation 10 is completed. Operation 40 is in progress. Operation 50 is scheduled for March 20. Shop floor managers do not need to chase for updates. Open the system and locate bottlenecks instantly.
Shop Floor Terminal: From Verbal Instructions to Digital Dispatching
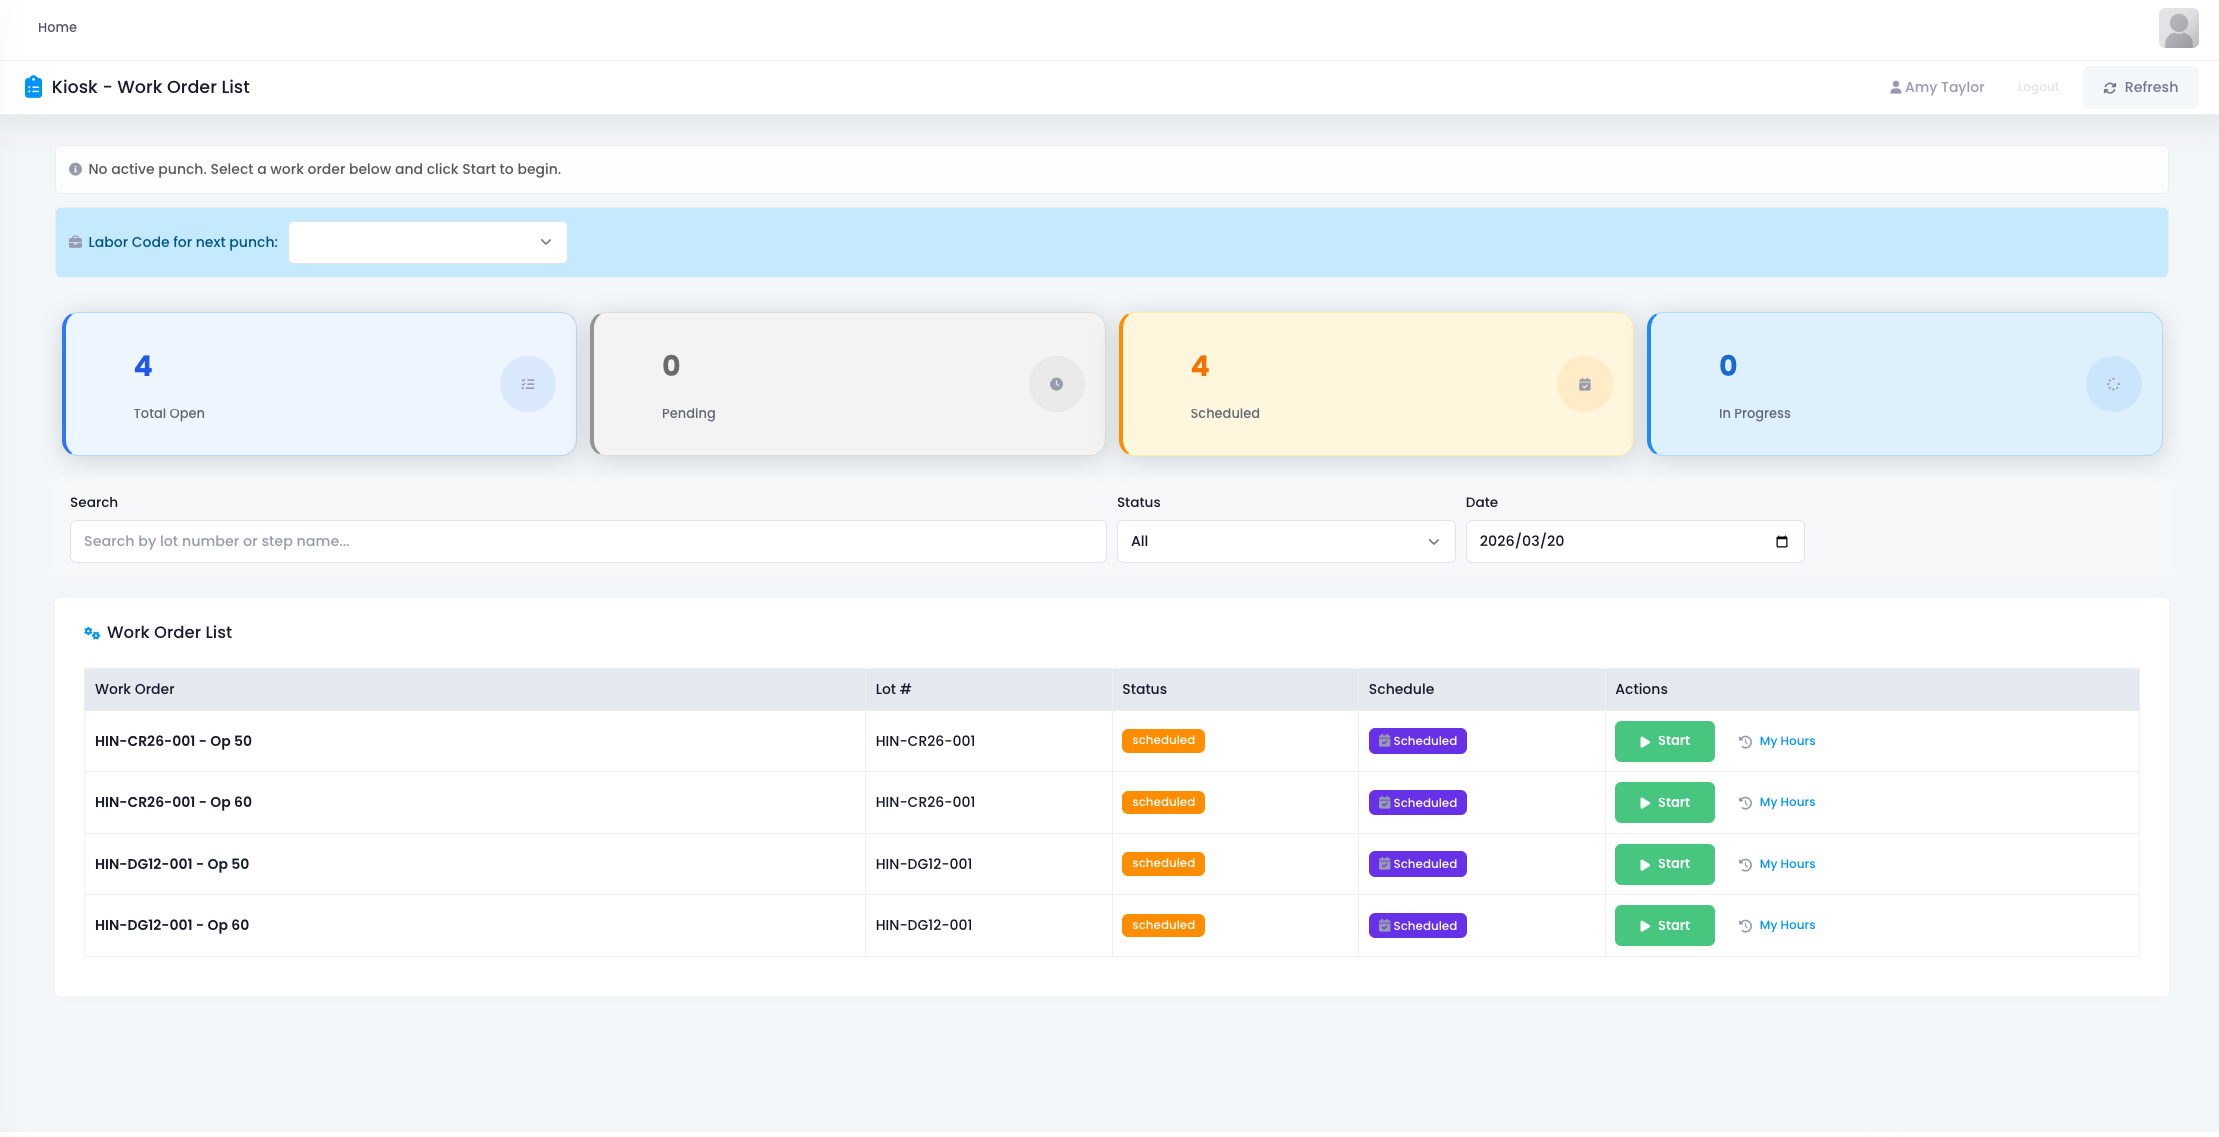
The shop floor terminal interface is designed for front line workers. After login, they see today's assigned work orders directly.
Operator Amy Taylor has not punched in yet. The screen clearly lists operations 50 and 60 for the cruiser, and operations 50 and 60 for the skiff. Click Start to begin work. Click My Hours to view personal work hours. Production instructions no longer rely on verbal handoffs or paper slips.
Scheduling Dashboard: From Manual Planning to Algorithm Optimization
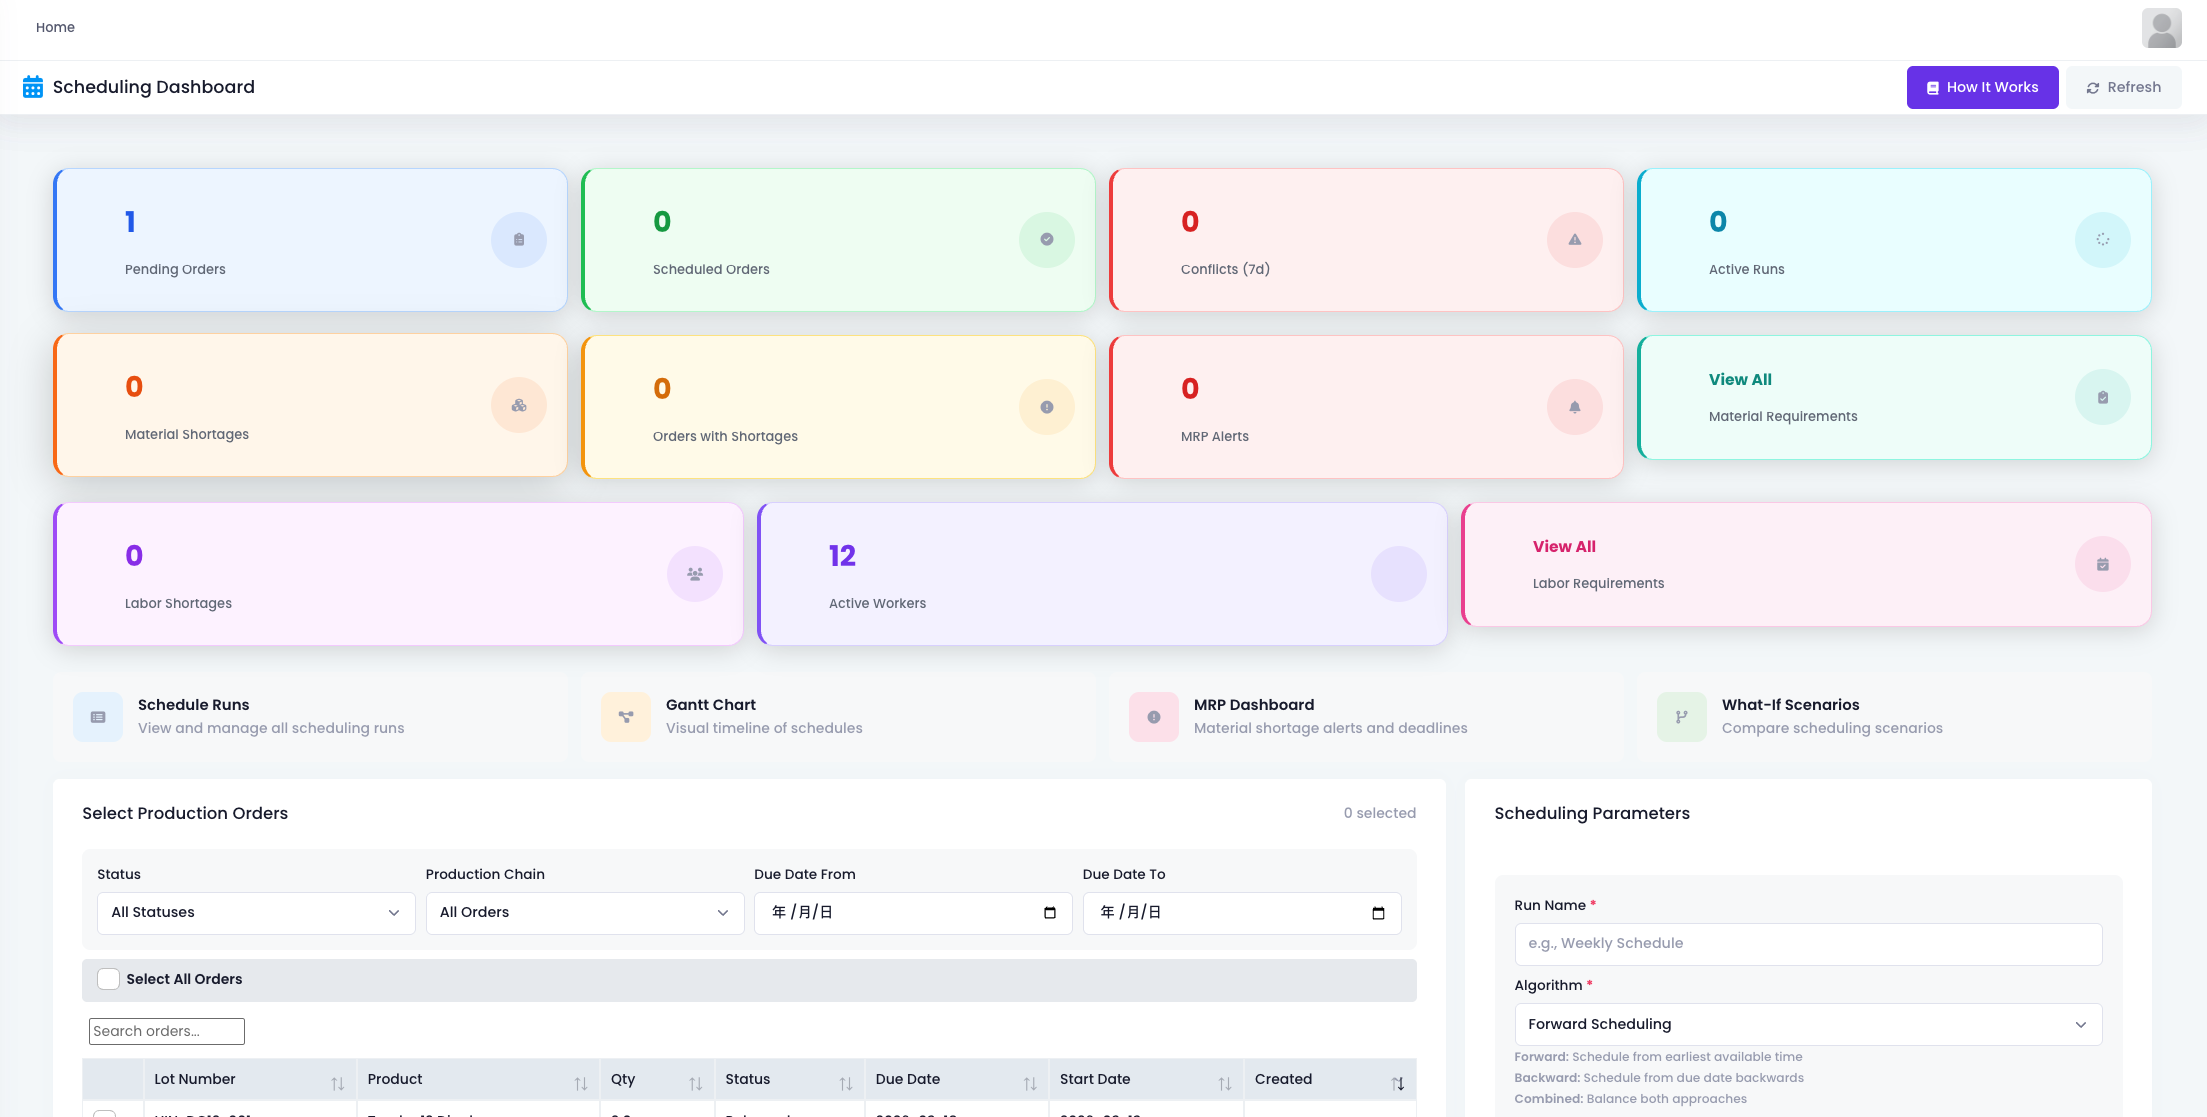
The scheduling dashboard aggregates key metrics at the top: one pending order, zero scheduled orders, zero material shortages, 12 active workers, zero MRP alerts.
Three entries on the right lead to schedule runs, Gantt chart, and MRP dashboard. Below, scheduling parameters support forward scheduling, backward scheduling, or combined optimization algorithms. Planners are freed from manually drawing Gantt charts.
Multi Dimensional Reports: From One Size Fits All to Layered Views
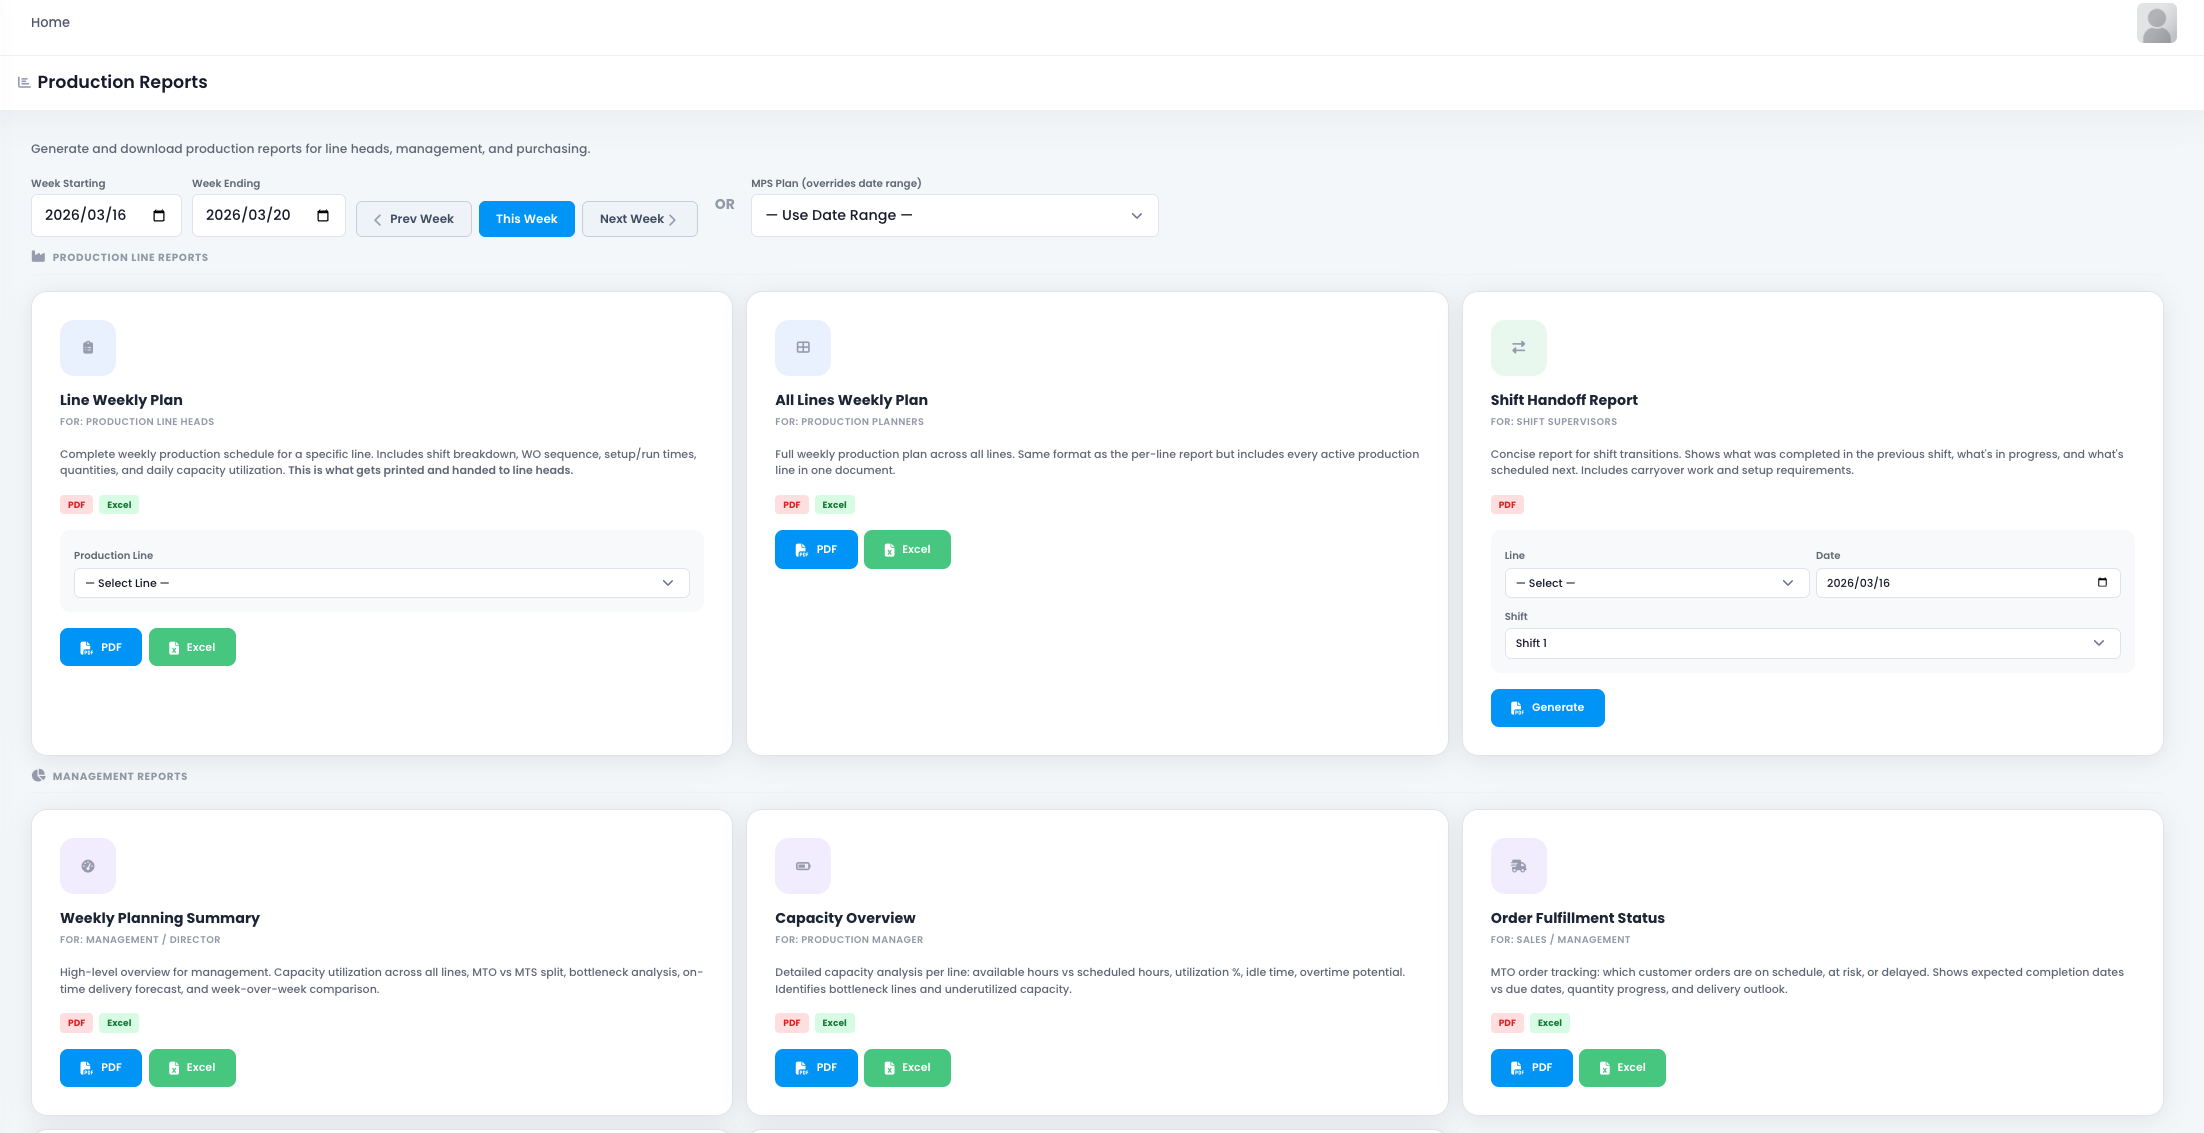
The reporting module provides customized views for different roles.
Line supervisors see weekly plans, clarifying daily tasks per line. Shift supervisors review handoff reports, understanding what the previous shift completed and what the next shift needs. Management accesses overview data: capacity utilization, on time delivery rates, bottleneck analysis. PDF and Excel formats are available to meet various distribution needs.
From Information Silos to Operational Closed Loop
In the traditional model, purchasing, inventory, BOM, planning, work orders, scheduling, and reporting each operated independently. Data rarely aligned. Progress depended on asking around. Decisions relied on accumulated experience.
When these core business modules are connected within the same platform, procurement receipts automatically update inventory, BOM consumption instantly deducts available quantities, work order execution feeds back into scheduling plans, and report data refreshes dynamically with business activity. Information flows automatically. Managers can shift their focus from data collection to business optimization.
From fragmentation to integration. From manual to automatic. From intuition to data. This is not simply stacking tools. It is the digital reconstruction of manufacturing operational logic.